
Cosmos price ($ATOM) has struggled below the key EMAs, held between a rock and a hard place near the crucial pivot of $4.40. Last week saw a dead cat bounce, and gains sold out, conveying the seller’s dominance.
The Cosmos price continued to form the lower lows, trading inside a falling channel pattern. It noted correction by over 35% in the past two months.
This week, Cosmos Hub announced the release of its v19 upgrade, which will enhance the efficiency and security of Cosmos Hub. Despite the positive developments, $ATOM price failed to register a pump and struggled in the downward region.
Nonetheless, it made a triple bottom formation around the $4.40 mark and was looking for a rise. This might lead to a trap for the sellers hoping for a drop.
$ATOM
— Dona 🥷 (@CryptoDona7) August 29, 2024
i was about to capitulate my bags , but noticed something 👀 pic.twitter.com/KefyjCJjQo
Tweet by CryptoDona | Source: X
Crypto analyst @Dona shared his charts, which reflected an Elliott Wave Analysis. He mentioned in his chart that Cosmo’s price reached its 3rd support wave. This can be considered a spring; from here, a bounce can be seen toward the $6 mark in the short term.
Considering this, $ATOM price may gain strength and see a short-term reversal. Also, the Bollinger bands were starting to squeeze, which hints that a near-term sharp move is on the horizon.
Cosmos Price Eyes a Bounce: is the $5 Mark Breachable?
This month, Cosmos price was stuck in a significant range and persisted in consolidating below the $5 mark. Amid multiple attempts to cross the barrier, buyers failed to maintain their upper hand.
Last week, the token faced rejection from the 50-day EMA mark and pushed toward $4.40, the key support zone.
The Relative Strength Index (RSI) line stayed neutral, moving close to 45 below the midline region, underlining mixed cues. A daily close above the $5 mark would confirm the bullish reversal, which might reach the upside target of the 100-day EMA barrier.
Per the Fib levels, $ATOM price was on the brink of the 23.6% support zone and inched closer to the lower Bollinger band support zone.
$ATOM Price Volume Chart | Source: Santiment
At press time, Cosmos traded at $4.65, up by 0.01%, and remained almost flat in the last 24 hours. Trading volume dropped over 23%, defining the losing investor’s interest.
With a market cap of over $1.53 Billion, $ATOM was at 55th rank, based on market cap. It had a volume-to-market cap ratio of 0.0403.
Liquidations Data Observed Bearish Cues
More than $159.25k longs were liquidated at press time, whereas only $21k shorts were liquidated. It represents that buyers are in trouble and trying to liquidate their position.
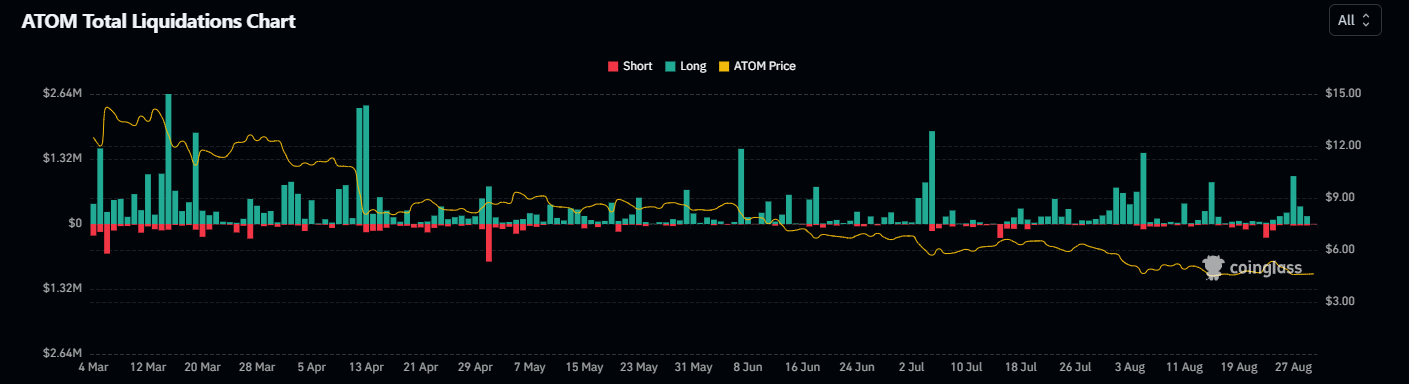
Liquidation Data | Source: Coinglass
Sharpe Ratio Remained Negative For Cosmos Price
Sharpe ratio value remained below zero for the past three months for Cosmos price, at -3.74. It means that sellers have maintained their upper hand and underlined a sustained downtrend.
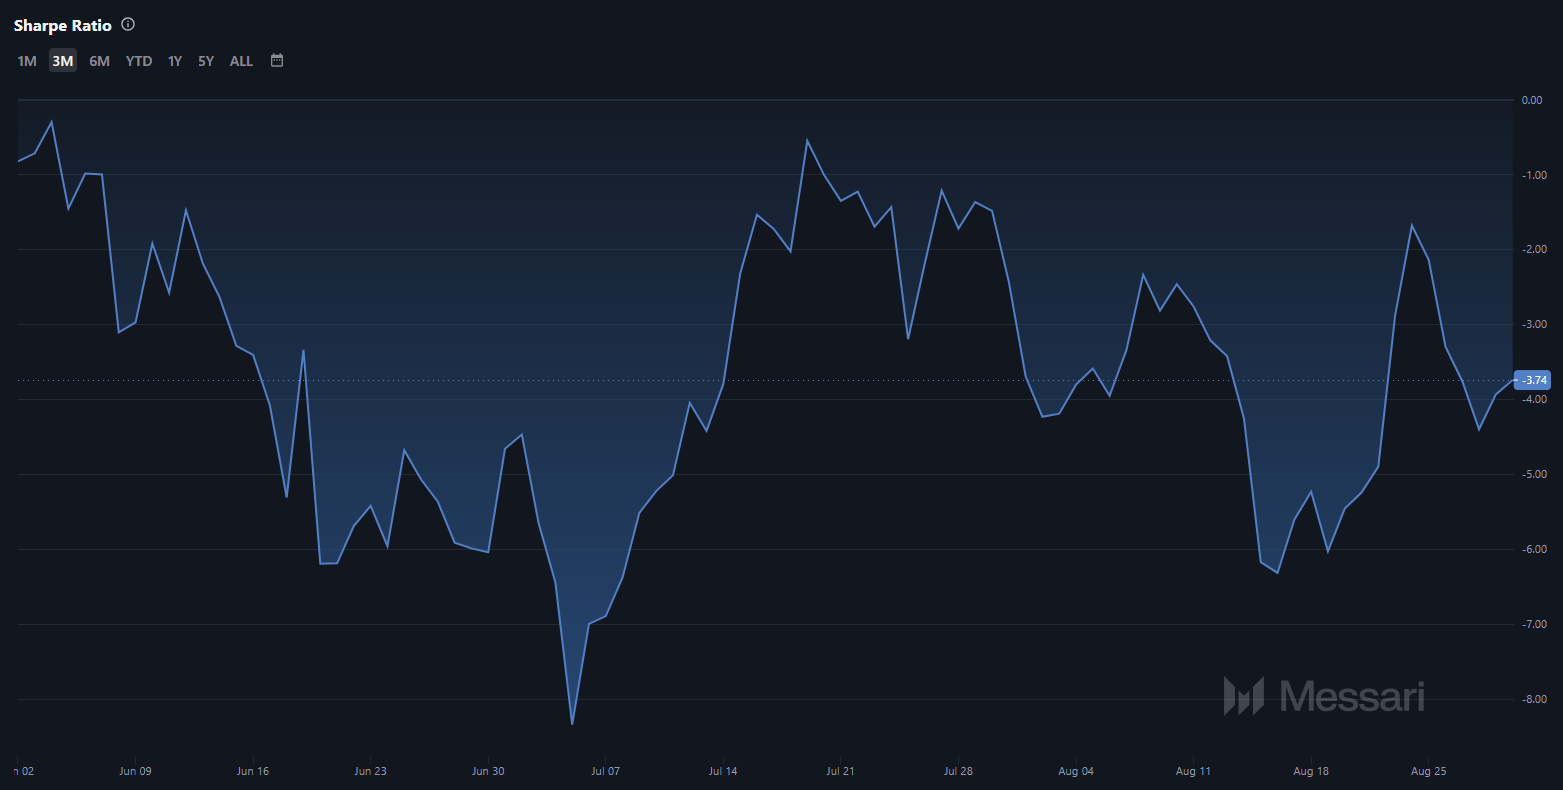
Sharpe Ratio Data Source: Messari
In a bearish scenario, breaking the $4 level would unlock the next bearish leg toward the $3.20 mark, followed by $2.70. However, the prompt resistance of the $5 mark is the crucial hurdle for Cosmos price. Above it, $5.70 and $6 will be the next barriers.