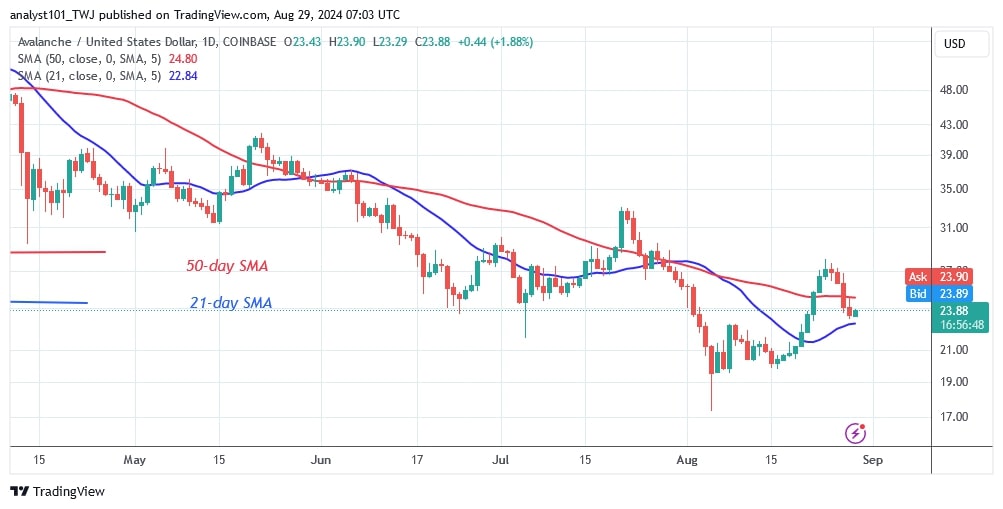
The price of Avalanche ($AVAX) is falling below the moving average lines after hitting a low of $17.35 before recovering.
Long-term analysis of the Avalanche price: bearish
The upside momentum was halted by the $28 resistance level. The cryptocurrency has now established a range between $20 and $28.
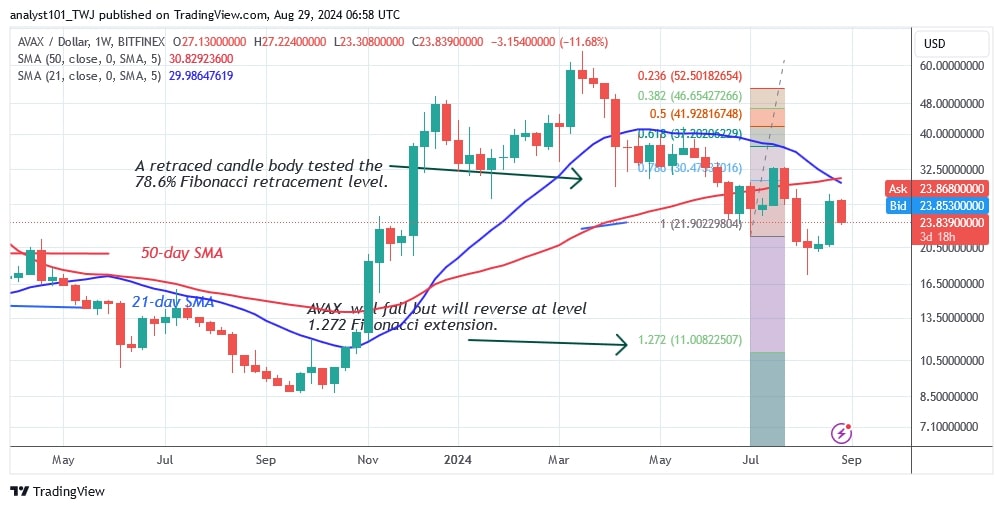
For the past three weeks, as reported by Coinidol.com before, the cryptocurrency has been trading in a range while the trend is still being determined. However, the price indication has signaled a likely decline in $AVAX. $AVAX is expected to fall and then reverse at the 1.272 Fibonacci extension level or $11.
In the meantime, the altcoin has fallen back into the lower price range. $AVAX will fall even lower to the low of the 1.272 Fibonacci extension or $11 if the bears break the current support level of $20. The altcoin is currently valued at $23.61.
Analysis of the Avalanche indicator
On the daily chart, $AVAX has retraced the moving average lines. This will force the altcoin to move in a range for a few days. When the moving averages are broken, the cryptocurrency will develop a trend. On the weekly chart, the moving average lines are showing a bearish crossover, with the 21-day SMA falling below the 50-day SMA. This is a bearish signal.
Technical Indicators:
Resistance Levels – $60 and $70
Support Levels – $30 and $20

What is the next direction for Avalanche?
After the drop on August 5, Avalanche's price has resumed its sideways movement. The bulls stopped the decline above the $20 support before resuming the uptrend. Nonetheless, the upside correction has remained stuck near the $28 high, resulting in a choppy movement for the cryptocurrency.

Disclaimer. This analysis and forecast are the personal opinions of the author. They are not a recommendation to buy or sell cryptocurrency and should not be viewed as an endorsement by CoinIdol.com. Readers should do their research before investing in funds.
 coinidol.com
