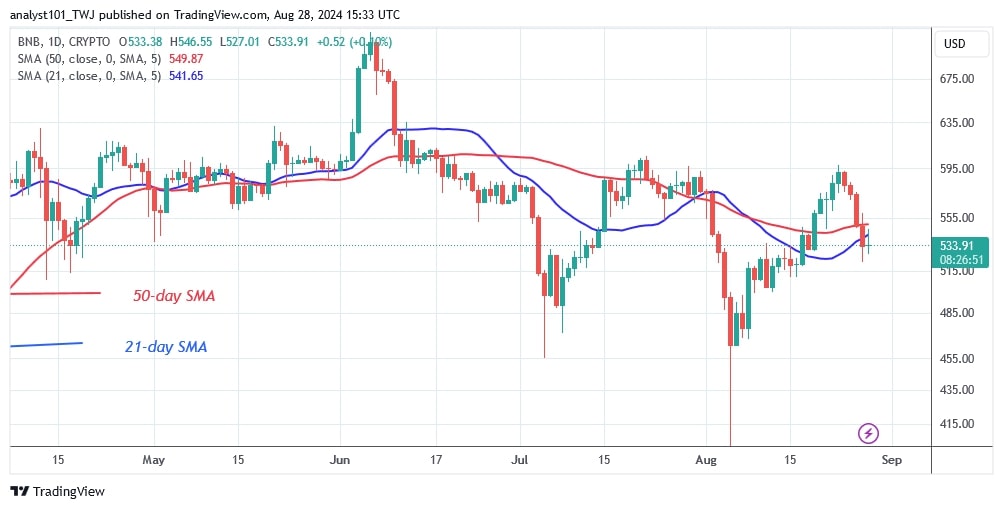
The price of BNB (BNB) has fallen below the moving average lines in a sideways trend. Selling pressure has eased since the price dipped on August 5.
On August 5, BNB or Binance coin fell to a low of $400 before recovering, as reported by Coinidol.com. Over the past three weeks, the altcoin has traded above the $470 support but below the $600 resistance level.
BNB price long-term prediction: bearish
Today, BNB is bearish and approaching the current support level of $470 on the daily chart. Currently, the price indicator for the cryptocurrency shows a further decline. If the existing support level is broken, BNB will fall back to its previous low of $400.
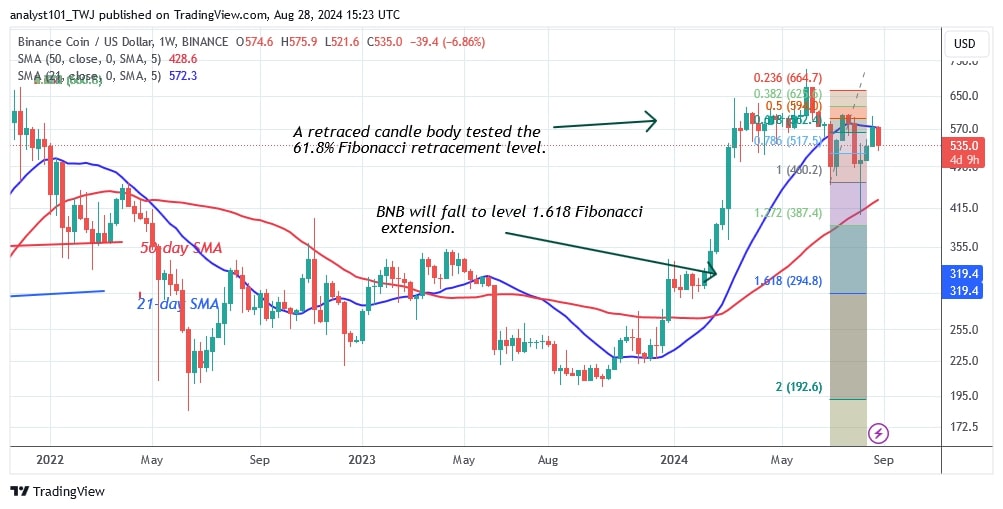
However, if the $400 support is broken, BNB will fall and return to the 1.618 Fibonacci extension level. On the upside, further upside for the cryptocurrency above $600 is doubtful.
BNB indicator reading
The price bars are below the moving average lines, indicating a possible decline. The moving average lines are sloping horizontally on the daily chart due to the sideways trend. On the weekly chart, the price bars are between the moving average lines, indicating that BNB will move in a range.
Technical indicators:
Key Resistance Levels – $600, $650, $700
Key Support Levels – $400, $350, $300

What is the next direction for BNB/USD?
The cryptocurrency has maintained its sideways trend while falling to previous lows. The weekly chart shows that upside moves have been rejected by the moving average lines or resistance at $570. BNB is likely to fall further as it faces rejection of its recent high. Meanwhile, the altcoin is trading within a range.

On August 23 the price of BNB was facing a first barrier at a high of $580, as reported before by Coinidol.com.
Disclaimer. This analysis and forecast are the personal opinions of the author. They are not a recommendation to buy or sell cryptocurrency and should not be viewed as an endorsement by CoinIdol.com. Readers should do their research before investing in funds.
 coinidol.com