- Bitcoin’s price hovers near a key resistance level and shows uncertain movements.
- Indicators like the RSI and MACD suggest mixed economy sentiment and possible trend changes.
- Traders closely watch key levels for signals of possible reversals or continued improvements.
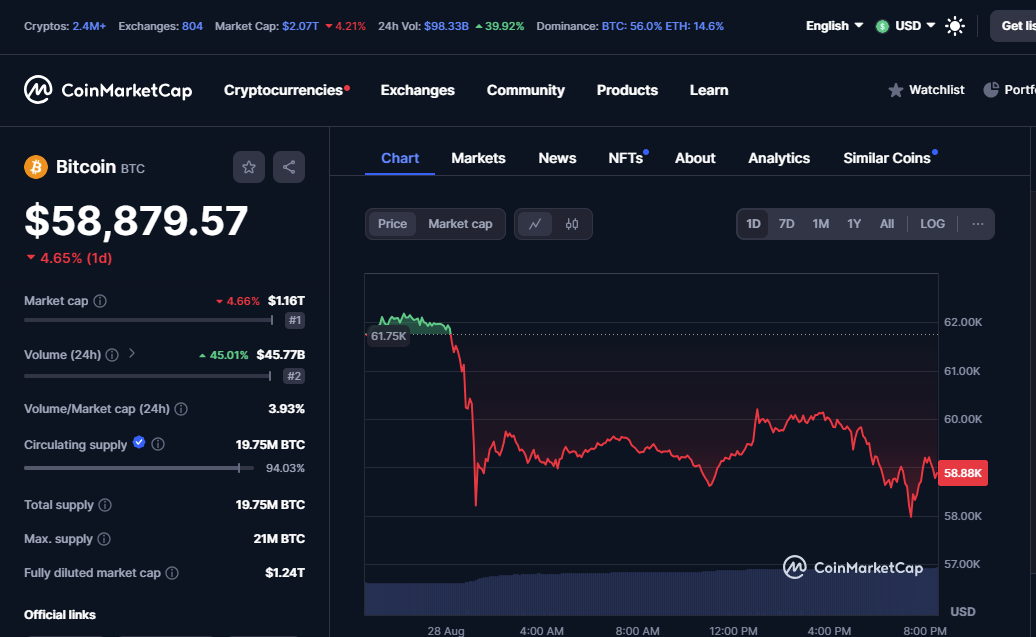
The coin’s value took a sudden dive on August 28, 2024, crashing to $58,879.57, marking a 4.65% decline over the previous day. The drop comes in between major instability in the crypto space, as BTC struggled to maintain its worth after touching a high of $61,750. This decrease in price also illustrates a reduction in its market cap, which has fallen 4.66% to $1.16 trillion.
 Source : coinmarketcap
The trading volume across the last 24 hours increased by 45.01%, reaching $45.77 billion. This spike in volume indicates heightened trading activity, possibly as investors reacted to the rapid price movements. The volume-to-market cap ratio stands at 3.93%, highlighting a moderately active trading period. The circulating supply of Bitcoin remains at 19.75 million, which is about 94.03% of the total supply, maintaining its maximum supply cap at 21M coins.
The fully diluted market cap, which assumes all currency are in circulation, is estimated at $1.24 trillion. The present trade scenario points out crucial unpredictability, with the token’s dominance at 56%, while Ethereum trails at 14.6%. As the industry awaits further developments, traders and analysts are closely observing these shifts to determine possible short-term developments.
Bitcoin Price Action
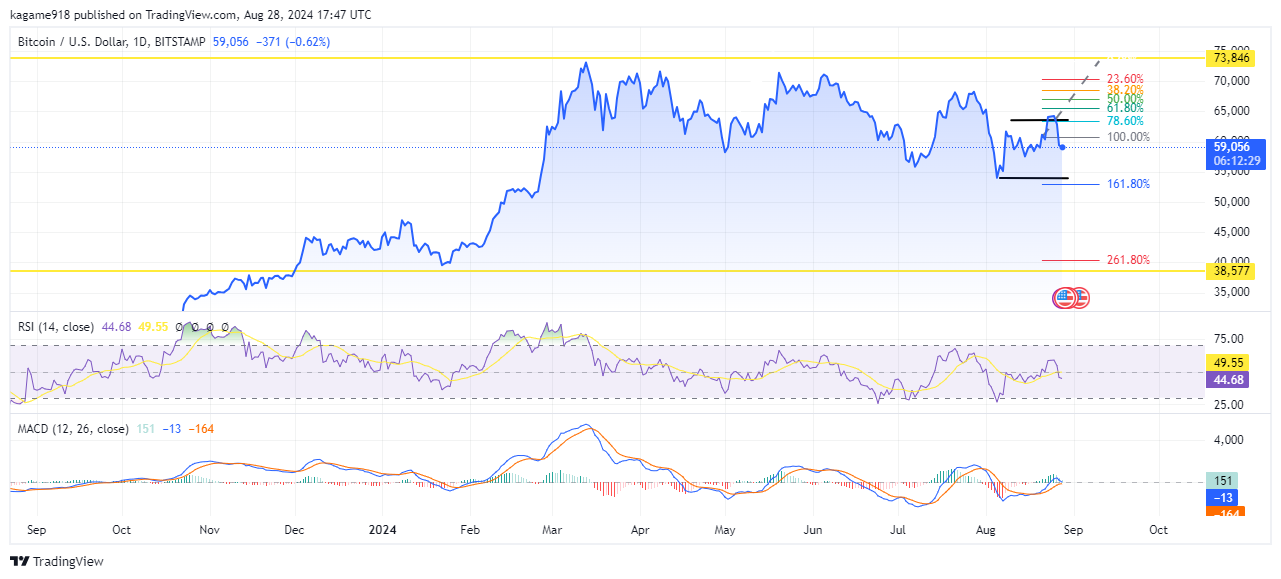
BTC continues to display signs of instability, trading at $59,055 after a tiny reduction of 0.63%. The current price action reveals a crucial battle between bulls and bears as BTC oscillates around key resistance and support levels.
 Source: tradingview
The Relative Strength Index, set at 14 days, is 44.67, suggesting a neutral stance with neither extreme overbought nor oversold conditions. This indicates that the market phrase remains balanced, awaiting a stronger signal for the next move. Meanwhile, the Moving Average Convergence Divergence Symbol shows a reading of 151 with a signal line at -13 and a histogram at -164, suggesting bearish upward motion as the MACD line is currently below the signal line.
The token’s retracement areas highlight considerable obstacle points at 23.60% ($73,846) and 38.20% ($70,000), while assistance levels are marked at 50.00% ($65,000) and 61.80% ($60,000). The cost is now moving near the 100% level, suggesting a possible Integration stage.. The crucial support stage to watch lies at 161.80% ($50,000), while a further drop could push BTC towards 261.80% ($38,577).
