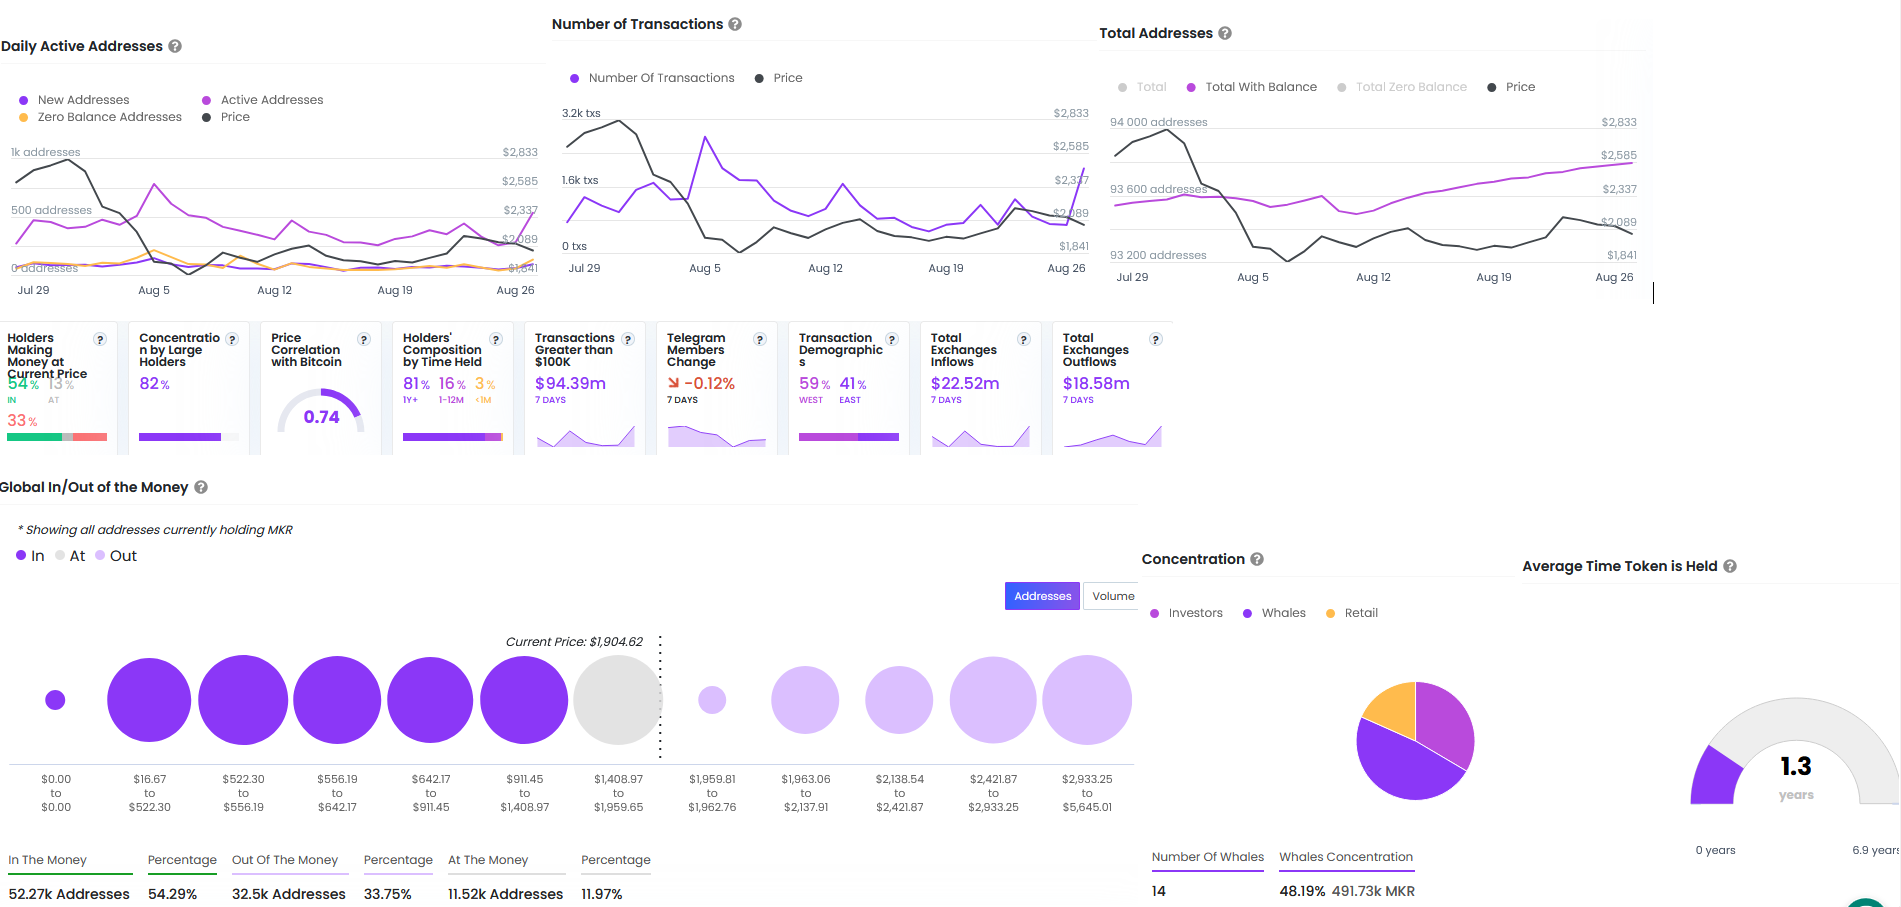
Maker (MKR) is the 47th most popular crypto, with a dominance of 0.08% in the crypto world. Recently, Maker price witnessed a dip. Its market cap by 6.75% in the last 24 hours, is now valued at $1.77 Billion.
The spot volume inflow had recently advanced by more than 220%, amounting to $172.711 Million. It signified the growing demand for Maker, its liquidity has advanced to 9.94% in the past 24 hours, showcasing a good liquid present.
Maker (MKR) Price: On-chain Data Overview
The daily active addresses were 536, which has witnessed growth from 283 addresses in a few days. On-chain data shows that 54.41% of the crypto holders are in profit, which is 52.39K addresses. 34.85% or 33.56K addresses incurred losses, while 10.34K addresses are sitting at the money, meaning no loss or profit state.
Similarly, the number of transactions has increased and reached 2.03K transactions, which was 675 a few days ago. Also, the average time for which MKR was held before transfer was 1.3 years before it moved out of the wallets of addresses.

At press time, the concentration by large holders stands at 82%, in which Whales hold 48.19% of the floating supply, and investors hold 33.48%.
Meanwhile, total outflows in exchanges surged to $18.58 Million last week, but inflows were higher at $22.52 Million. This overpowered Maker price due to a significant difference in the number of sell-offs and accusations, resulting in a price dip in the last few days.
What Does Derivatives Data Analysis Highlight for Maker?
The derivatives data at a glance exhibited explosive growth of 91.29% in the derivatives volume, which amounted to $239.66 Million. This resulted in a surge of demand for assets in the derivatives market. Meanwhile, current behavior this week in price has led MKR to heavy long liquidations at 621.87K, while shorts were $11.90K. This showed bear dominance in the MKR asset.

The assets OI increased by a modest 1.3% in the last 24 hours of activity at the time of writing. This was valued at $100.45 Million.
Maker (MKR) Technical Chart Data?
On a daily timeframe, it witnessed that the peak of $4075 was built after the bull run in the first quarter of 2024. Thereon, the price had fallen into a wedge and has followed this downward channel for nearly the next two quarters of 2024.
If the downtrend persists, the channel could extend more by the end of the third quarter of 2024. However, to accelerate the fall, the bears need to overpower the $1850 level, which has proved sturdies in the long term.
Overall, the indicators depict bearishness: 20-day, 50-day, and 200-day EMA are bearish; MACD was also in the bearish territory, and RSI was flashed at 39.02.
Therefore, the resistance levels are at $2091, and $2493, respectively. However, in case of further fall, the supports could be present at $1775, and $1567, respectively.
 thecoinrepublic.com
