
Dogecoin ($DOGE) has experienced a steady decline in value over the past month, dropping more than 20% in 30 days. This downward trend has pushed its price below both its 50-day simple moving average (SMA) and 20-day exponential moving average (EMA).
This signals growing selling pressure and indicates that $DOGE could face further downward movement.
Dogecoin Faces Resistance, but There Is a Catch
On August 23, $DOGE attempted to break above its 50-day SMA at $0.11 but encountered strong bearish resistance. This pressure pushed the price downward, leading to a drop below its 20-day EMA by Monday.
The 20-day EMA is a short-term indicator that quickly responds to price changes, reflecting the average closing price over the past 20 days. In contrast, the 50-day SMA is a longer-term indicator, showing the average closing price over the past 50 days.
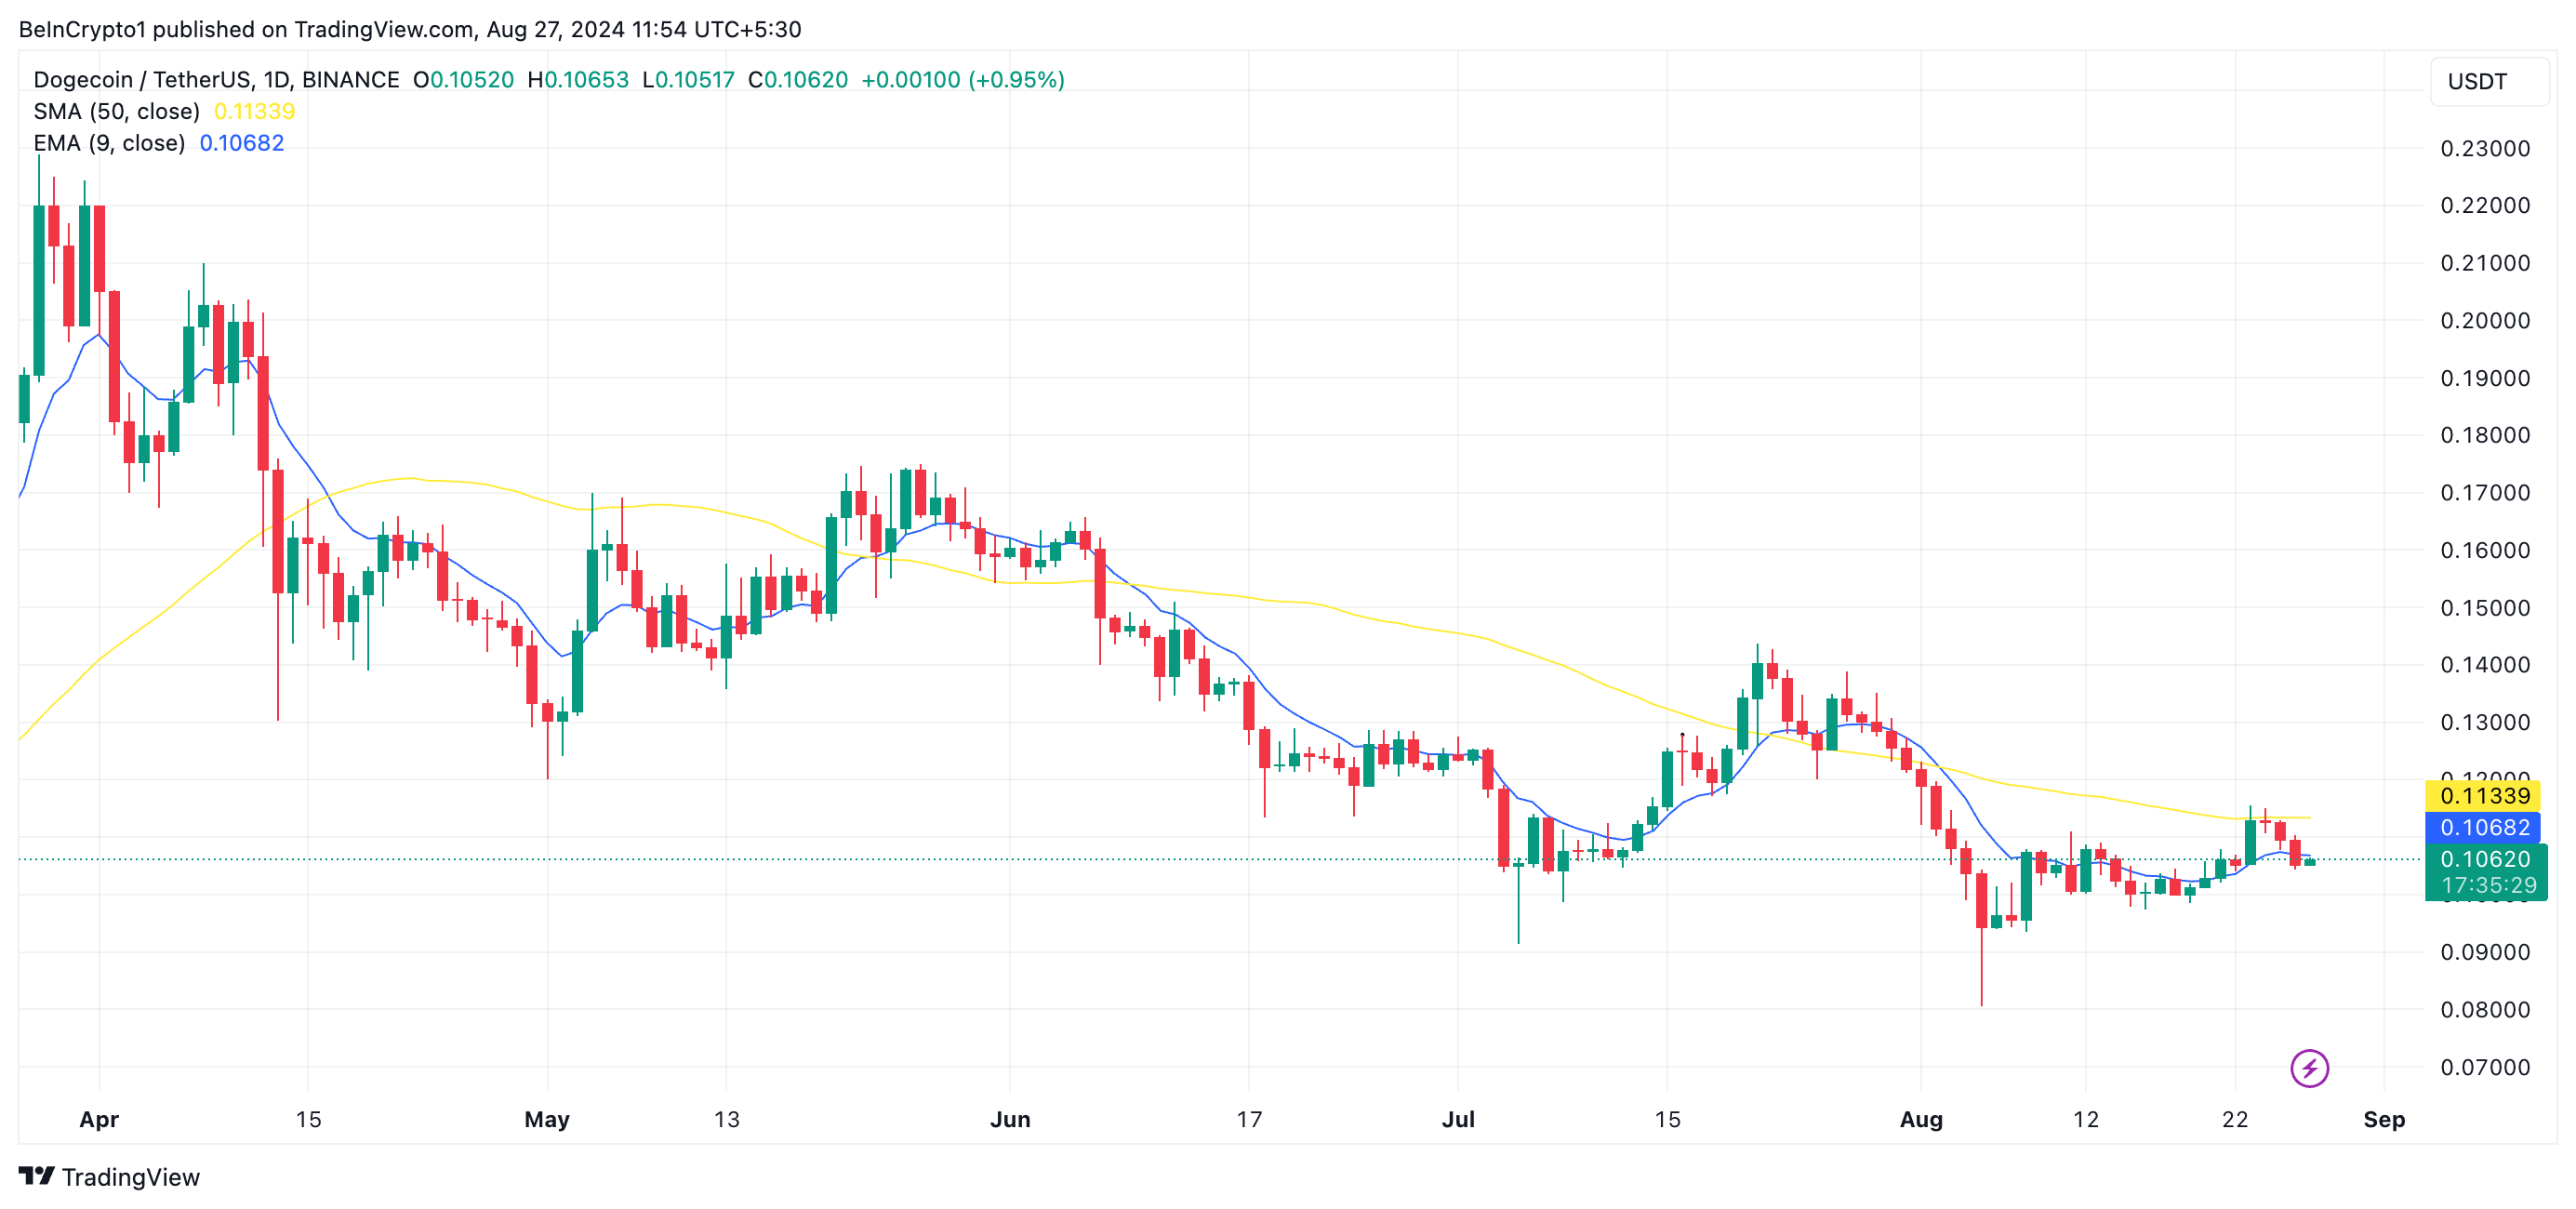
When an asset’s price drops below these levels, sellers take control, indicating a short-to-medium-term downtrend. In such scenarios, these moving averages often act as resistance, making it difficult for the price to climb above them in the near term.
However, $DOGE’s Chaikin Money Flow (CMF) readings hint that the downtrend could be nearing its end. The momentum indicator has started an uptrend, crossing above the zero line. At press time, $DOGE’s CMF stands at 0.04.
Read more: Dogecoin ($DOGE) Price Prediction 2024/2025/2030
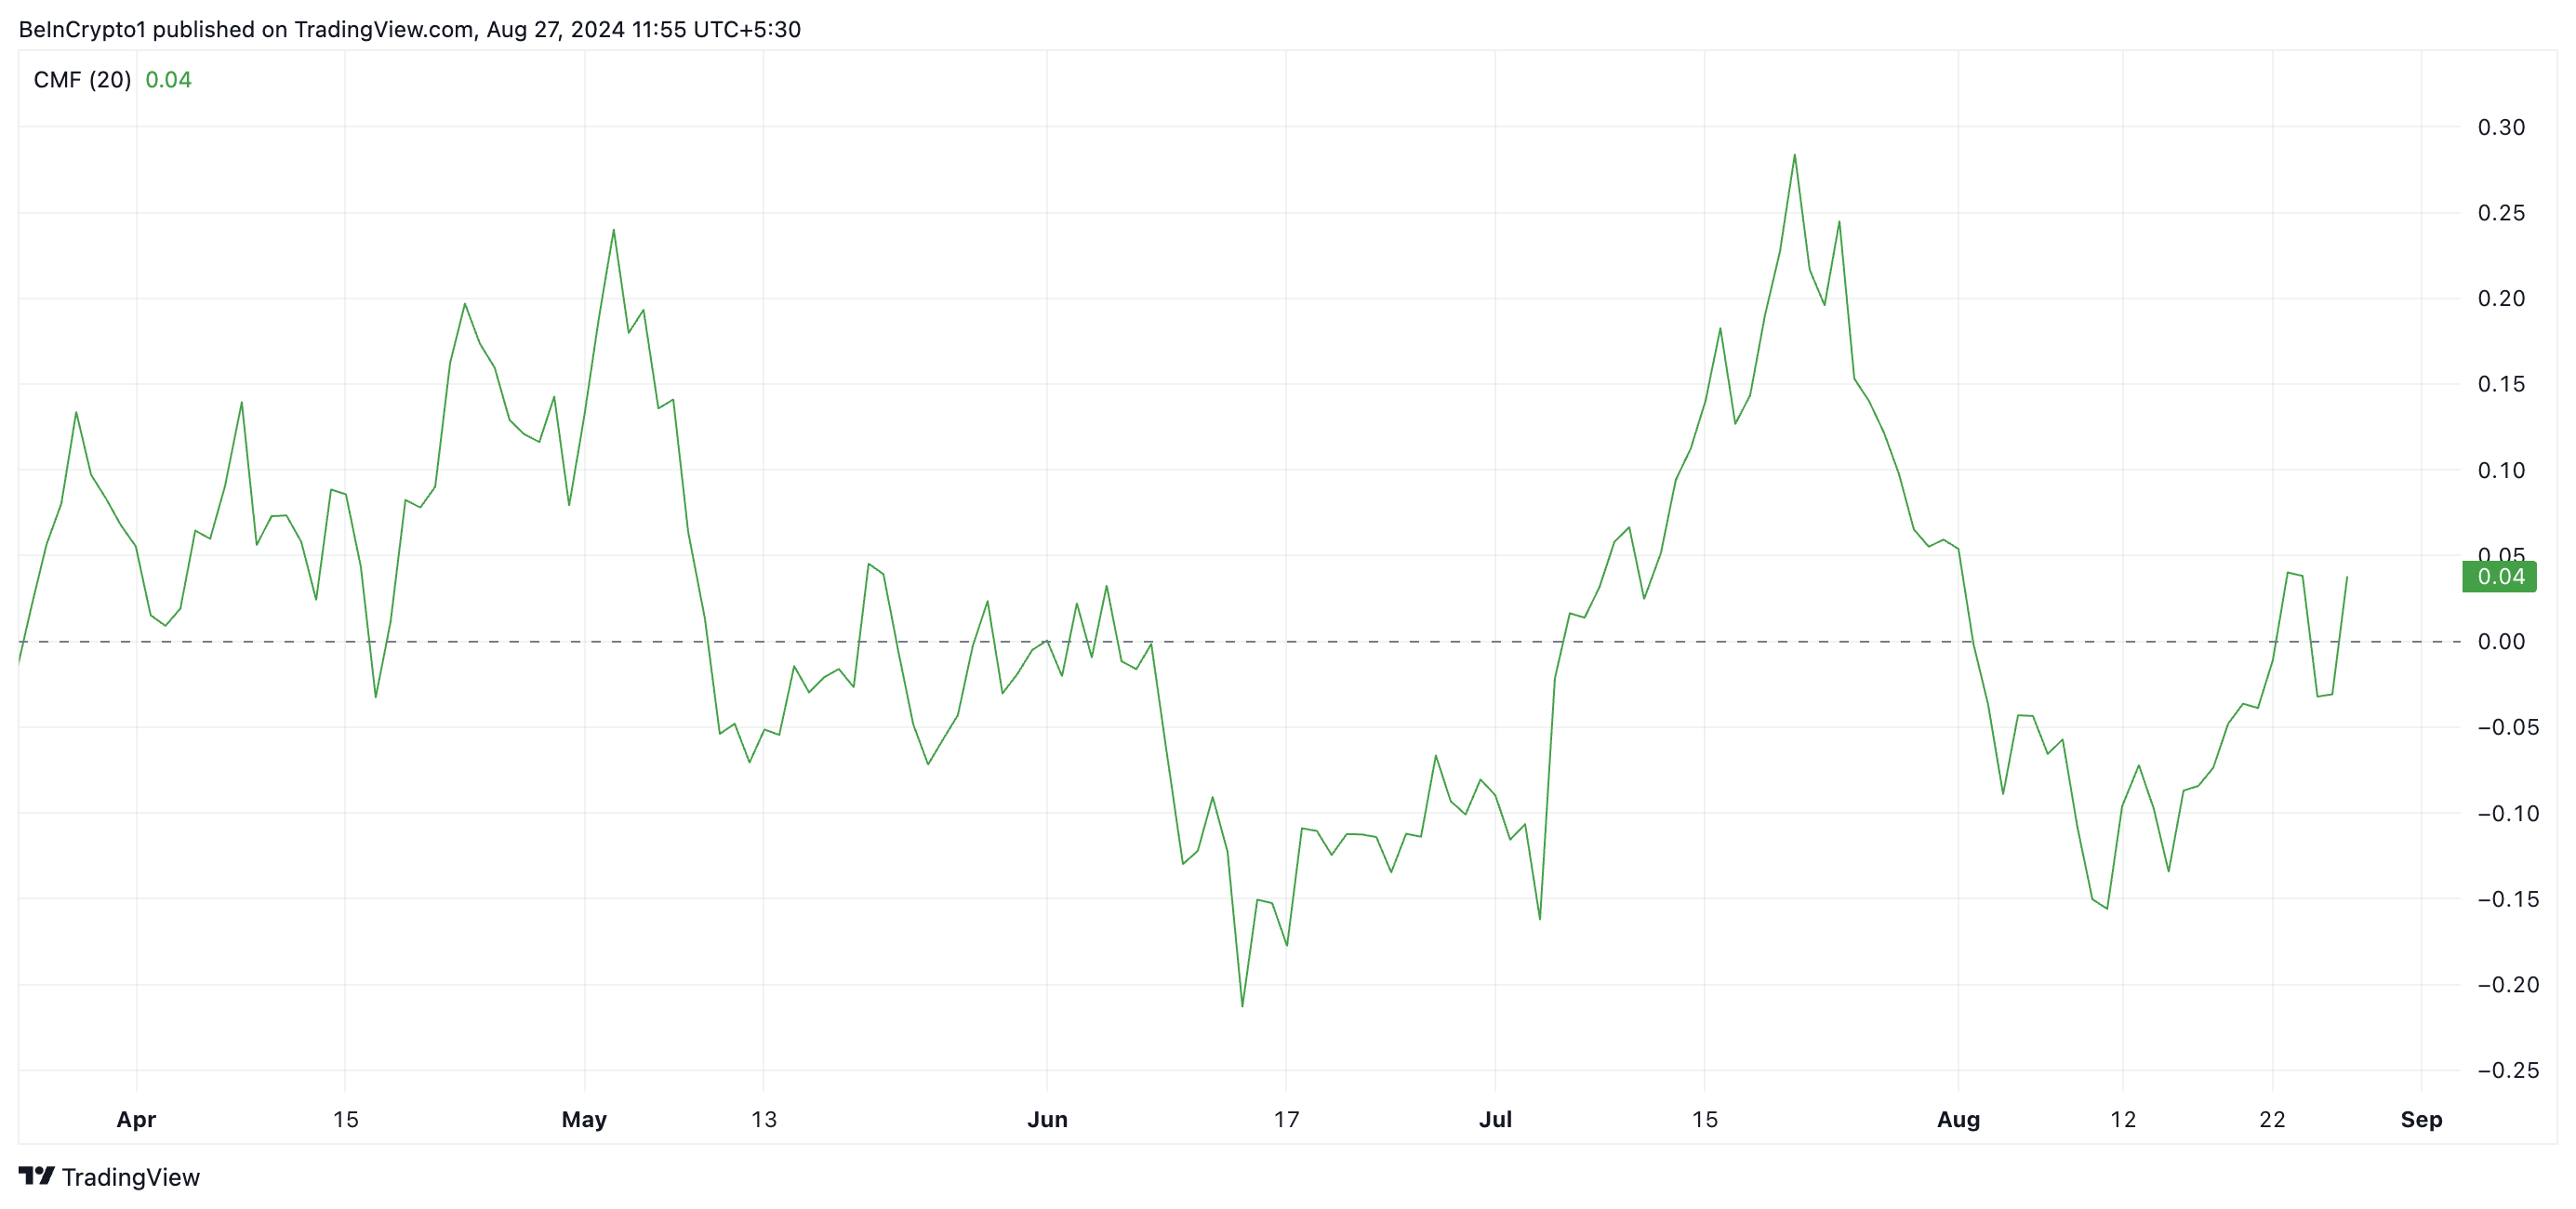
A bullish divergence occurs when an asset’s price declines while its CMF rises. This suggests that the selling pressure behind the price drop is weakening, making a rebound likely.
$DOGE Price Prediction: Hopefuls Await Rebound
In addition to $DOGE’s Chaikin Money Flow (CMF), its Moving Average Convergence Divergence (MACD) setup also suggests a potential rebound. Currently, the MACD line (blue) is above the signal line (orange) and is approaching a crossover above the center line.
The MACD tracks an asset’s price trend, direction, and momentum shifts. When the MACD line is above the signal line, it indicates a bullish trend, driven by strong buying momentum. A move above the zero line confirms this bullish trend and often prompts traders to go long.
Read more: Dogecoin ($DOGE) vs Shiba Inu (SHIB): What’s the Difference?
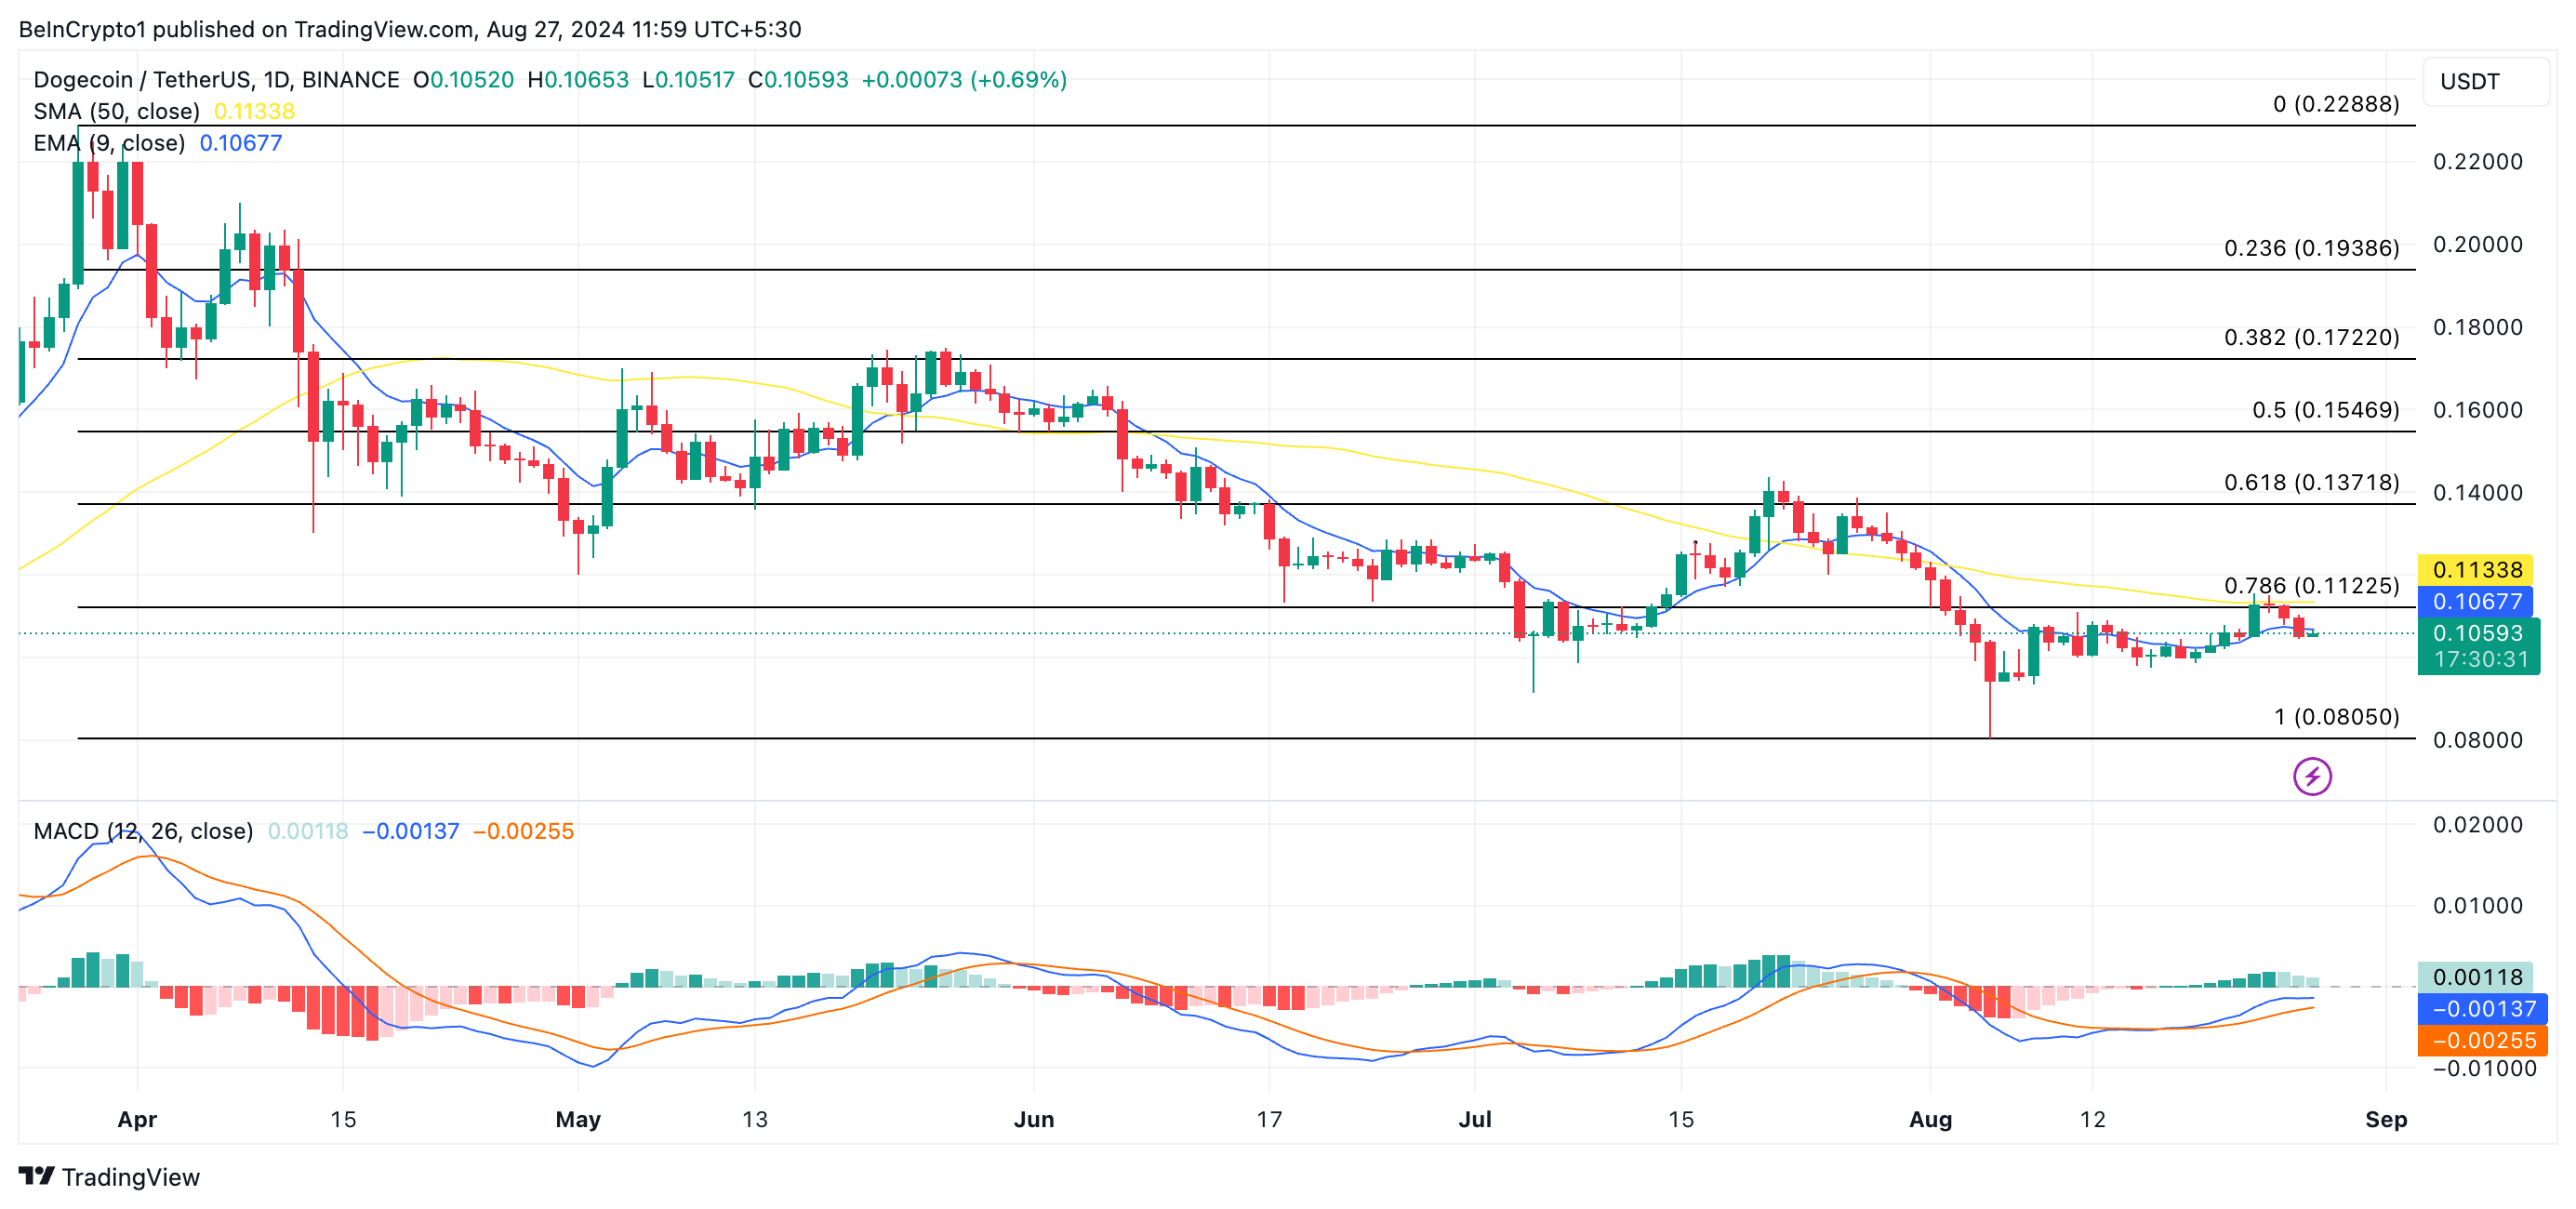
If the bullish momentum continues to build and demand for $DOGE increases, it could break through the resistance at the 50-day SMA and 20-day EMA, pushing the meme coin’s price to $0.13. However, if the downtrend continues, $DOGE’s price could drop further below these key levels, potentially falling to $0.08.