On Sunday, Tron (TRX) founder Justin Sun announced that the community has approved raising the network’s energy cap to 120 billion. This was necessary following last week’s congestion due to activity on SunPump platform.
This decision has caused TRX’s price to climb by almost 5% over the past 24 hours to hit a 3-year high of $0.16.
Tron Faces Uncertainty Amidst Market Volatility
By raising Tron’s energy cap, users can now process more transactions on the network at reduced fees. This positive development has led to an increase in the demand for TRX over the past 24 hours. Its daily trading volume has surged by 46% to reach $923 million during that period.
At press time, the altcoin traded at $0.16, witnessing a 4% price uptick. The last time TRX traded at this price level was on May 27, 2021. Over the past seven days, the altcoin’s price has climbed by 22%.
However, TRX’s price rally has been accompanied by a massive surge in market volatility, as evidenced by the widening gap between the upper and lower bands of its Bollinger Bands indicator.
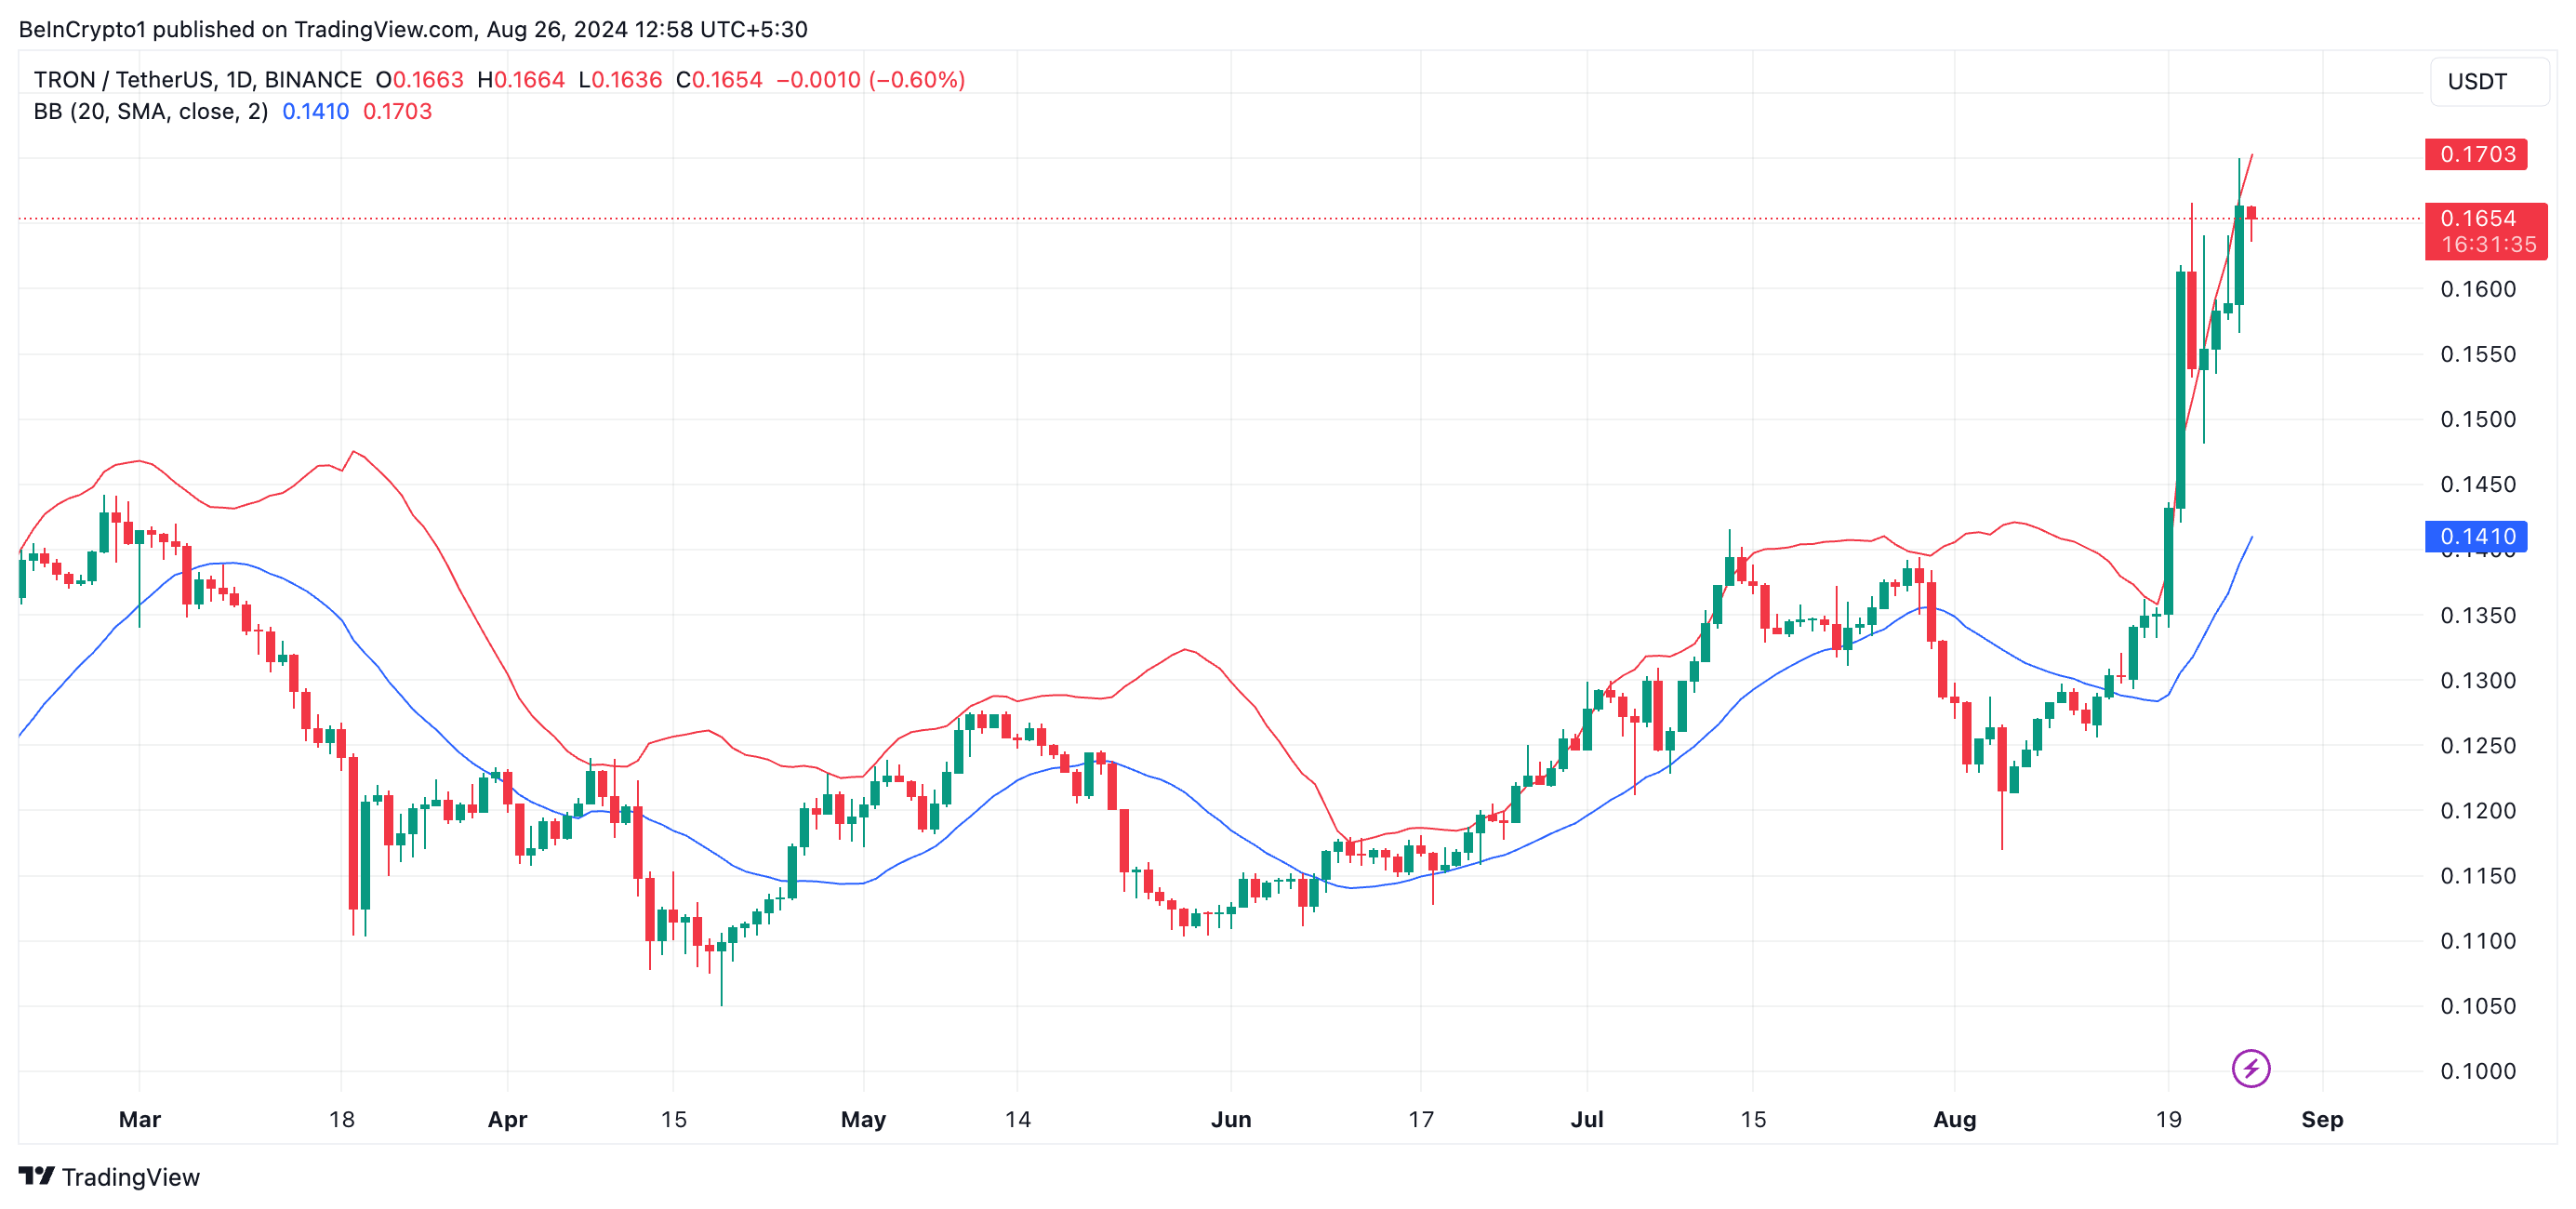
This indicator measures market volatility and identifies potential overbought or oversold conditions. The upper band represents the higher range of an asset’s price movements, while the lower band tracks the lower range. When the gap between these bands widens, it suggests that market volatility has increased.
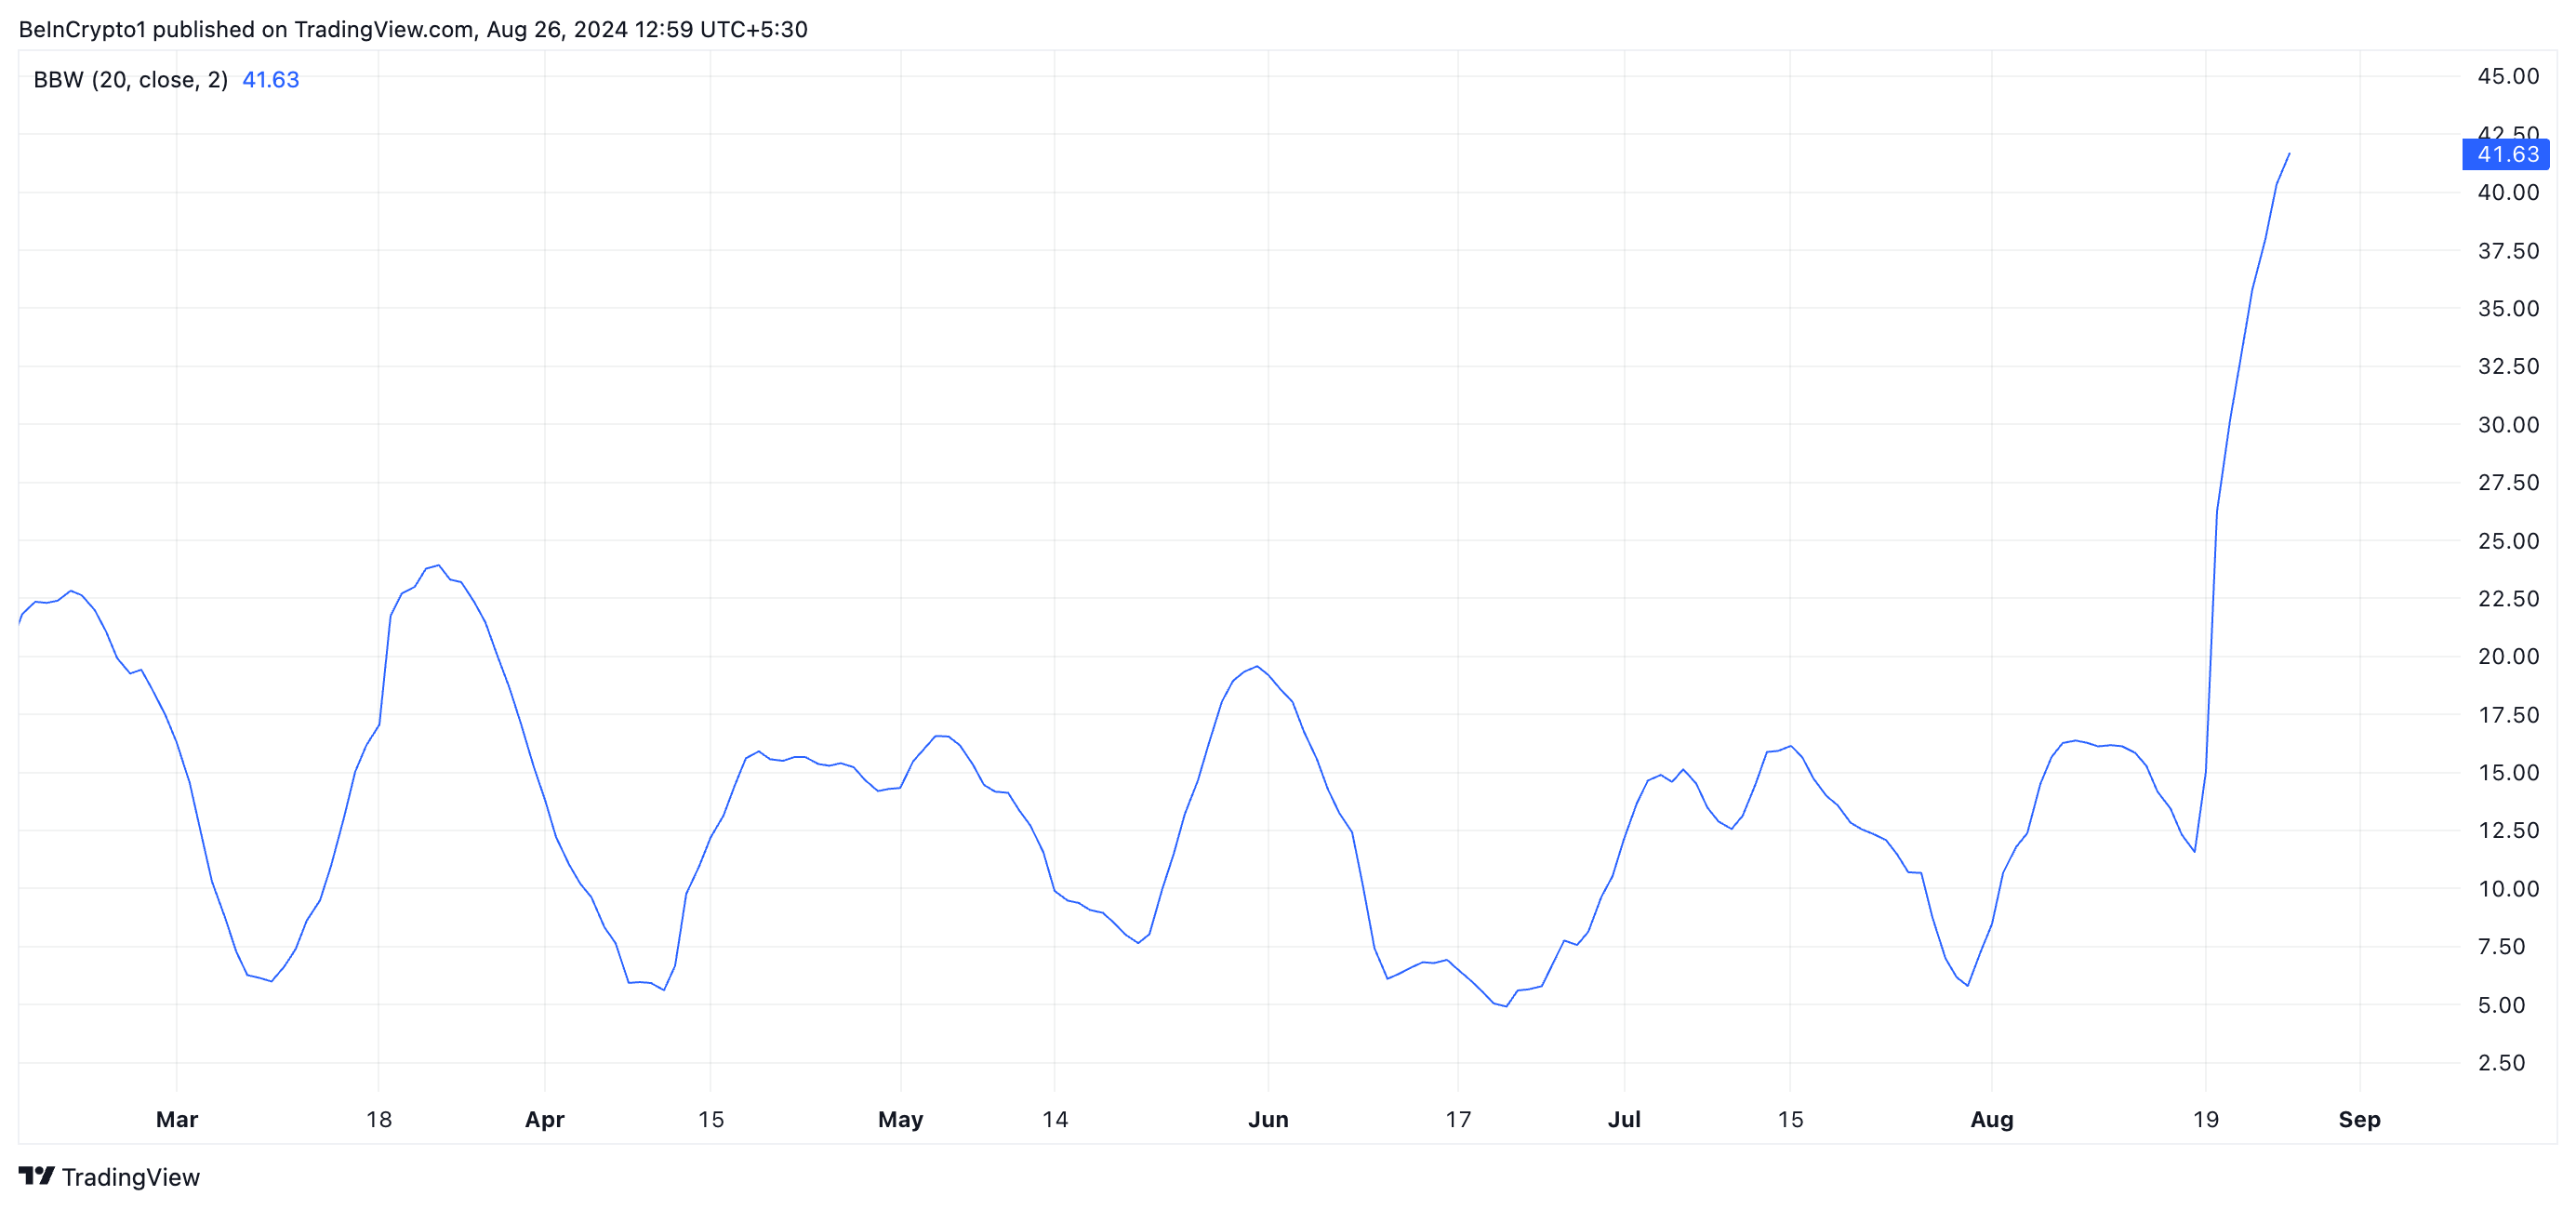
Further, TRX’s Bollinger Bandwidth — which helps traders gauge the market’s volatility and identify potential breakout opportunities — has risen to its highest level since June. As of this writing, the coin’s Bollinger Bandwidth is 41.63, having increased by over 250% in the past seven days.
A rising bandwidth such as this indicates that TRX’s bands are far apart, confirming high market volatility.
Read more: What Is TRON (TRX) and How Does It Work?
TRX Price Prediction: Watch Out For Buyers’ Exhaustion
The TRX token is currently in overbought territory, which signals an increased likelihood of a price correction. The Relative Strength Index (RSI) for TRX currently sits at 76.67.
The RSI is a popular tool that gauges whether an asset is overbought or oversold, with readings between 0 and 100. An RSI above 70 typically indicates an overbought condition, which often precedes a pullback. Conversely, an RSI below 30 suggests oversold conditions, hinting at a potential bounce.
At its current RSI of 76.67, TRX indicates that buyers are becoming exhausted, making a price dip more likely in the near term.
Read More: TRON (TRX) Price Prediction 2024/2025/2030
If this happens, TRX’s price may fall to $0.14, a 13% fall from its current value. However, if the bulls manage to defend the rally and the surge continues, TRX’s value may climb to $0.17.