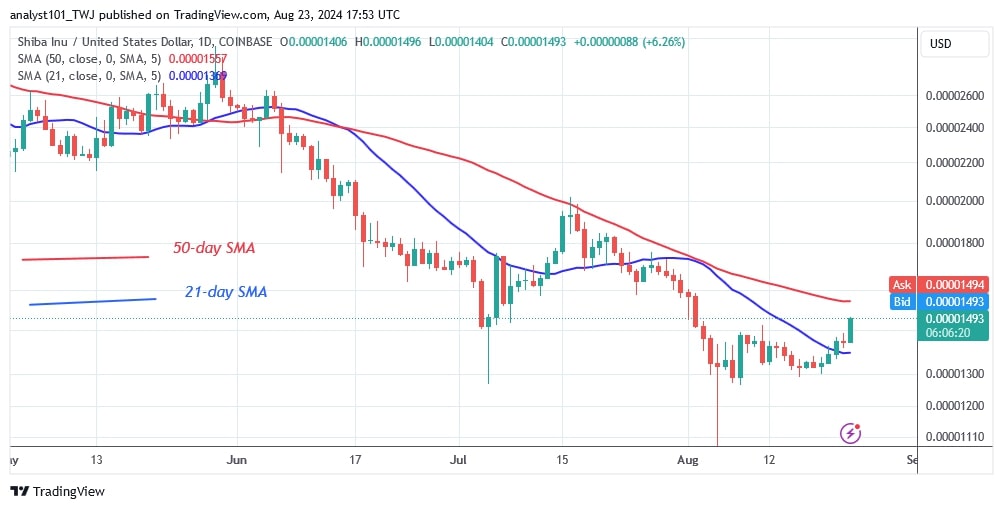
The price of Shiba Inu ($SHIB) has recovered but is currently trading between the moving average lines. The cryptocurrency is recovering from its low of $0.00001079.
$SHIB price long-term prediction: bearish
$SHIB has reached a high of $0.00001514 but is currently trading between the moving average lines on the daily chart. The uptrend could encounter resistance at the 50-day moving average line or the high at $0.00001600. A break above the resistance level will propel the altcoin to a high of $0.00002000. A rejection at the 50-day SMA will force the cryptocurrency to decline and resume oscillation between the moving average lines.
Selling pressure will pick up again if the price falls below the 21-day SMA support. $SHIB is now worth $0.00001508.
$SHIB indicator analysis
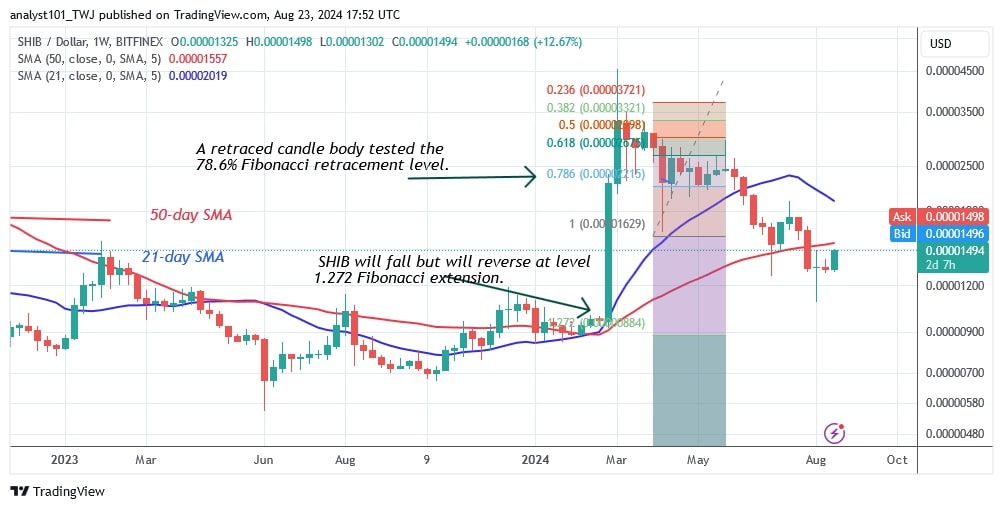
$SHIB has risen above the 21-day SMA resistance but is approaching the 50-day SMA. The moving average lines are trending south, indicating a downtrend. Despite the recent upward movement, the altcoin remains in a bearish trend zone.
Technical indicators
Key Resistance levels: $0.00001200, $0.00001300, $000001400
Key Support levels: $0.00000600, $0.00000550, $0.00000450

What is the next move for Shiba Inu?
According to price analysis by Coinidol.com, $SHIB is recovering and breaking above the 21-day SMA but continues to move towards the 50-day SMA. Currently, $SHIB is between the moving average lines. If the moving averages are broken, the altcoin will develop a trend. Otherwise, the market will continue to move between the moving averages.

On August 5, the altcoin reached a low of $0.00001079 before recovering, as reported by Coinidol.com.
Disclaimer. This analysis and forecast are the personal opinions of the author. They are not a recommendation to buy or sell cryptocurrency and should not be viewed as an endorsement by CoinIdol.com. Readers should do their research before investing in funds.
 coinidol.com
