
XRP, the seventh largest cryptocurrency by market capitalization, has recently formed a "death cross" on its four-hour chart. This technical pattern occurs when a short-term moving average crosses below a long-term moving average and is regarded as a bearish signal.
A death cross typically involves the 50-period moving average crossing below the 200-period moving average. In the case of XRP, this pattern has emerged on the four-hour chart, suggesting that short-term price action is weakening relative to the longer-term trend.
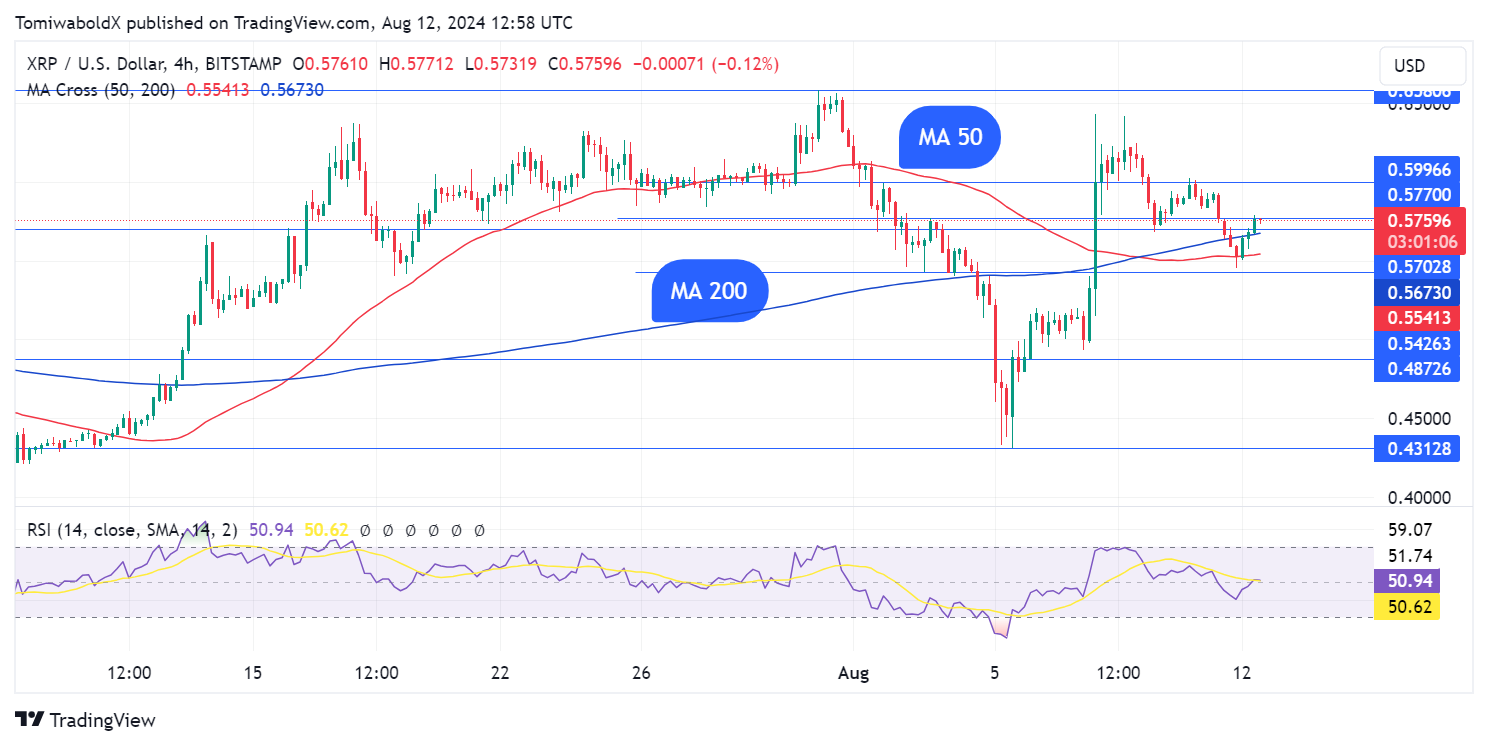
The appearance of a death cross on the XRP charts fuels concerns about XRP's short-term price trajectory.
However, it is important to note that while the death cross is a bearish indicator, it does not guarantee further declines. Market conditions, investor sentiment and external factors can all influence the price action, potentially counteracting the death cross signal.
What's the XRP price in for?
At the time of writing, XRP was down 0.23% in the last 24 hours to $0.576 and up 30% weekly. XRP currently presents a mixed outlook, with bulls and bears battling for supremacy.
XRP's price dipped after reaching highs of $0.643 on Aug. 8. The declines reached lows of $0.546 in yesterday's trading session, coinciding with the crypto market sell-off.
XRP is currently attempting a rebound, with prices reaching highs of $0.5799 in today's trading session. On the upside, any sustained recovery might face resistance at $0.643 and $0.659, which may act as a ceiling for price action.
The immediate support levels to watch are the daily moving average 200 at $0.544 and the daily SMA 50 at $0.533. If the XRP price falls below this level, it could trigger further selling pressure, potentially pushing XRP down to $0.432.