$XRP recently formed a hammer pattern on the weekly chart, with analyst Dark Defender citing historical data of previous formation that led to a 110K% surge.
The market analyst disclosed this in one of his recent analyses of $XRP’s price movements. Notably, $XRP had faced intense bearish pressure following its impressive price run toward the end of July. After spiking to a high of $0.6580 on July 31, August brought bearish pressure.
The bearish pressure was mostly due to selloffs across the broader crypto market amid geopolitical risks. $XRP collapsed as the first full week of August progressed, leading to the formation of a hammer candlestick pattern. Dark Defender was the first to identify this hammer formation, emphasizing its importance in the grand scheme of things.
$XRP Weekly Hammer Candlestick
For the uninitiated, a hammer candlestick is a bullish reversal pattern that forms after a downtrend. It has a small body and a long lower shadow, with little or no upper shadow. This pattern indicates that despite selling pressure, buyers are stepping in, which could signal a potential price reversal.
Dark Defender cited historical data to support this thesis. He called attention to a previous hammer candlestick formation on the weekly chart from 2017. According to him, this hammer pattern formed in March 2017, merely three weeks before $XRP experienced its meteoric run.
However, The Crypto Basic could not confirm this formation on the $XRP/USD weekly chart from Bitstamp. Instead, we found that this pattern actually formed in January 2017. Notably, during this time, $XRP opened at $0.00674, crashed to a low of $0.00300, then recovered to close the week at $0.00640, forming the hammer.
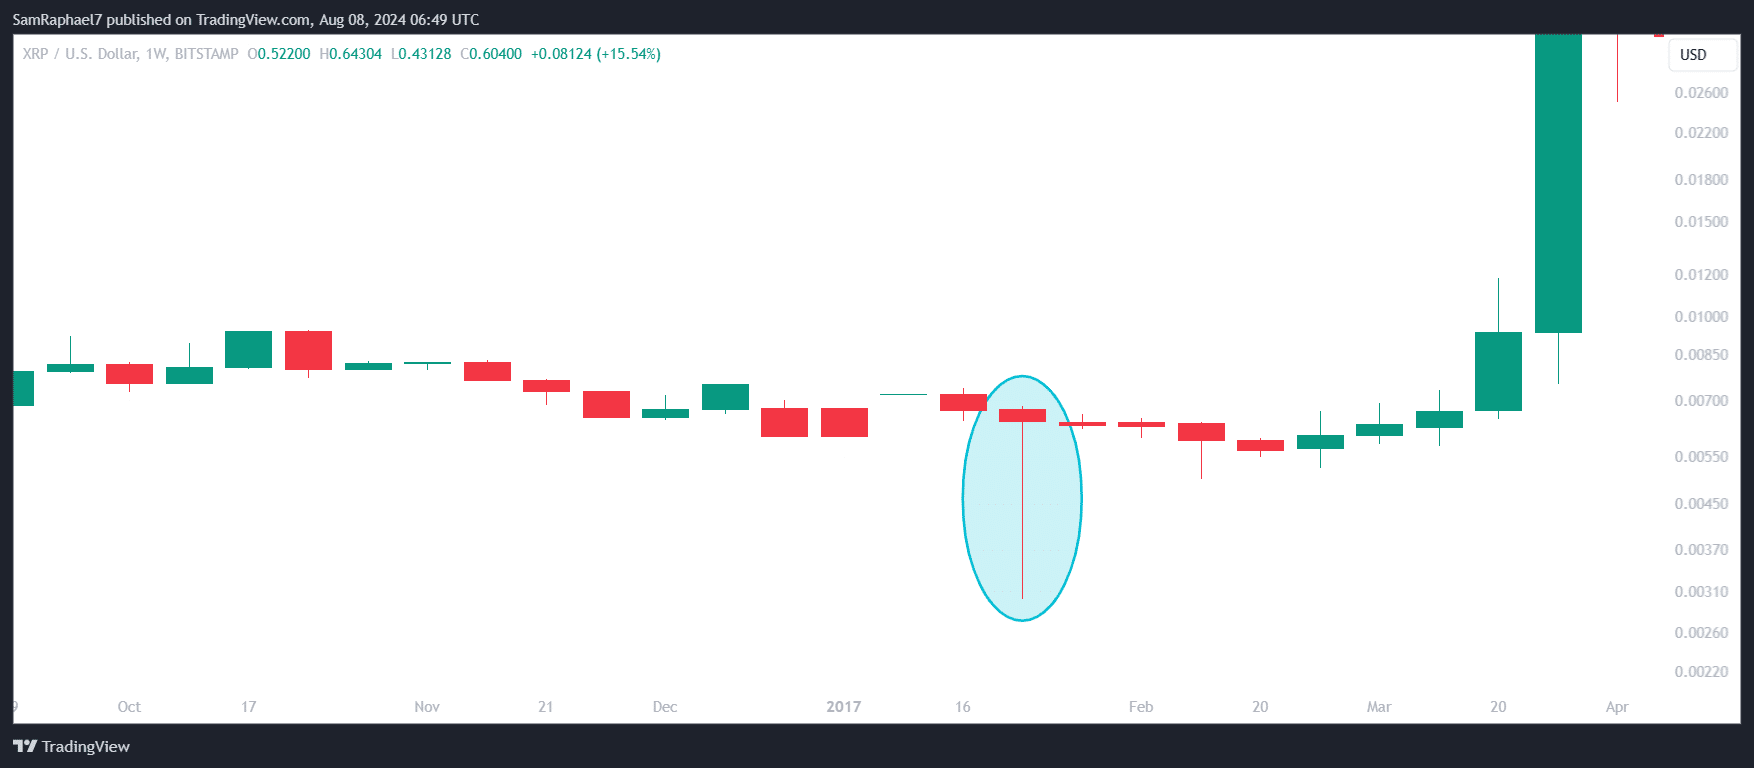
This hammer occurred amid a downtrend for $XRP during the pre-bull run phase of the 2017 cycle. At the time, Bitcoin (BTC) and other assets recorded upsurges, while $XRP underperformed. This is similar to the ongoing trend in this cycle.
$XRP Targets Meteoric Surge
In 2017, following the hammer formation, $XRP continued to drop for four more weeks before embarking in a recovery. However, this recovery push was monumental, with $XRP soaring to the $3.31 all-time high in January 2018. This marked a massive 110,233% increase from the January 2017 low of $0.003 within a year.
Though not explicitly stated, Dark Defender’s analysis suggests a repetition of a similar uptrend. However, the extent of this uptrend remains speculative. In an analysis last month, the market watcher set a $5 price target for $XRP amid a daily bull flag formation. However, in March, he suggested he is looking out for a $333 $XRP price.
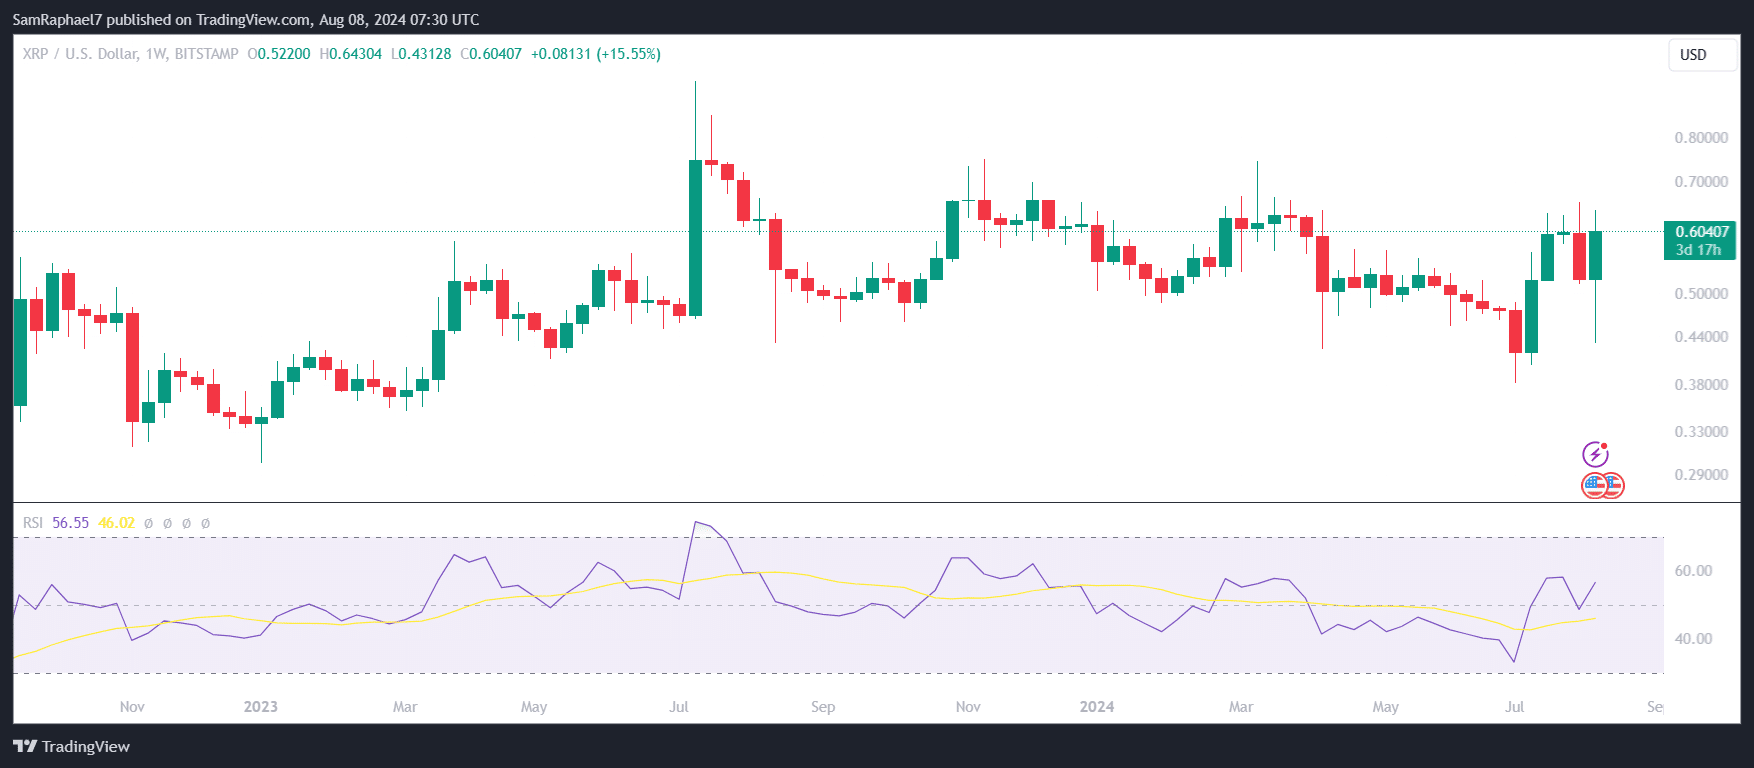
Meanwhile, recent data from $XRP’s weekly chart indicates that the latest explosive surge has erased the hammer candle formation. $XRP surged by more than 30% within 24 hours following the resolution of the SEC case, now up 15% this week. Currently trading for $0.6046, the asset has recovered the 13% loss of the previous week, with a recent RSI spike.