
Polkadot’s ($DOT) price has plummeted over 10% in the past week. Monday’s market troubles caused it to trade below the $5 price level for the first time since November 2023. On that day, the altcoin even plunged to a low of $3.75 before rebounding.
Currently trading at $4.59, $DOT now faces a steep climb back above the $5 mark.
Polkadot Faces Headwinds as It Attempts to Reclaim $5
$DOT’s key technical indicators assessed on a one-day chart suggest that a break above the $5 price mark might be challenging as selling pressure gains momentum.
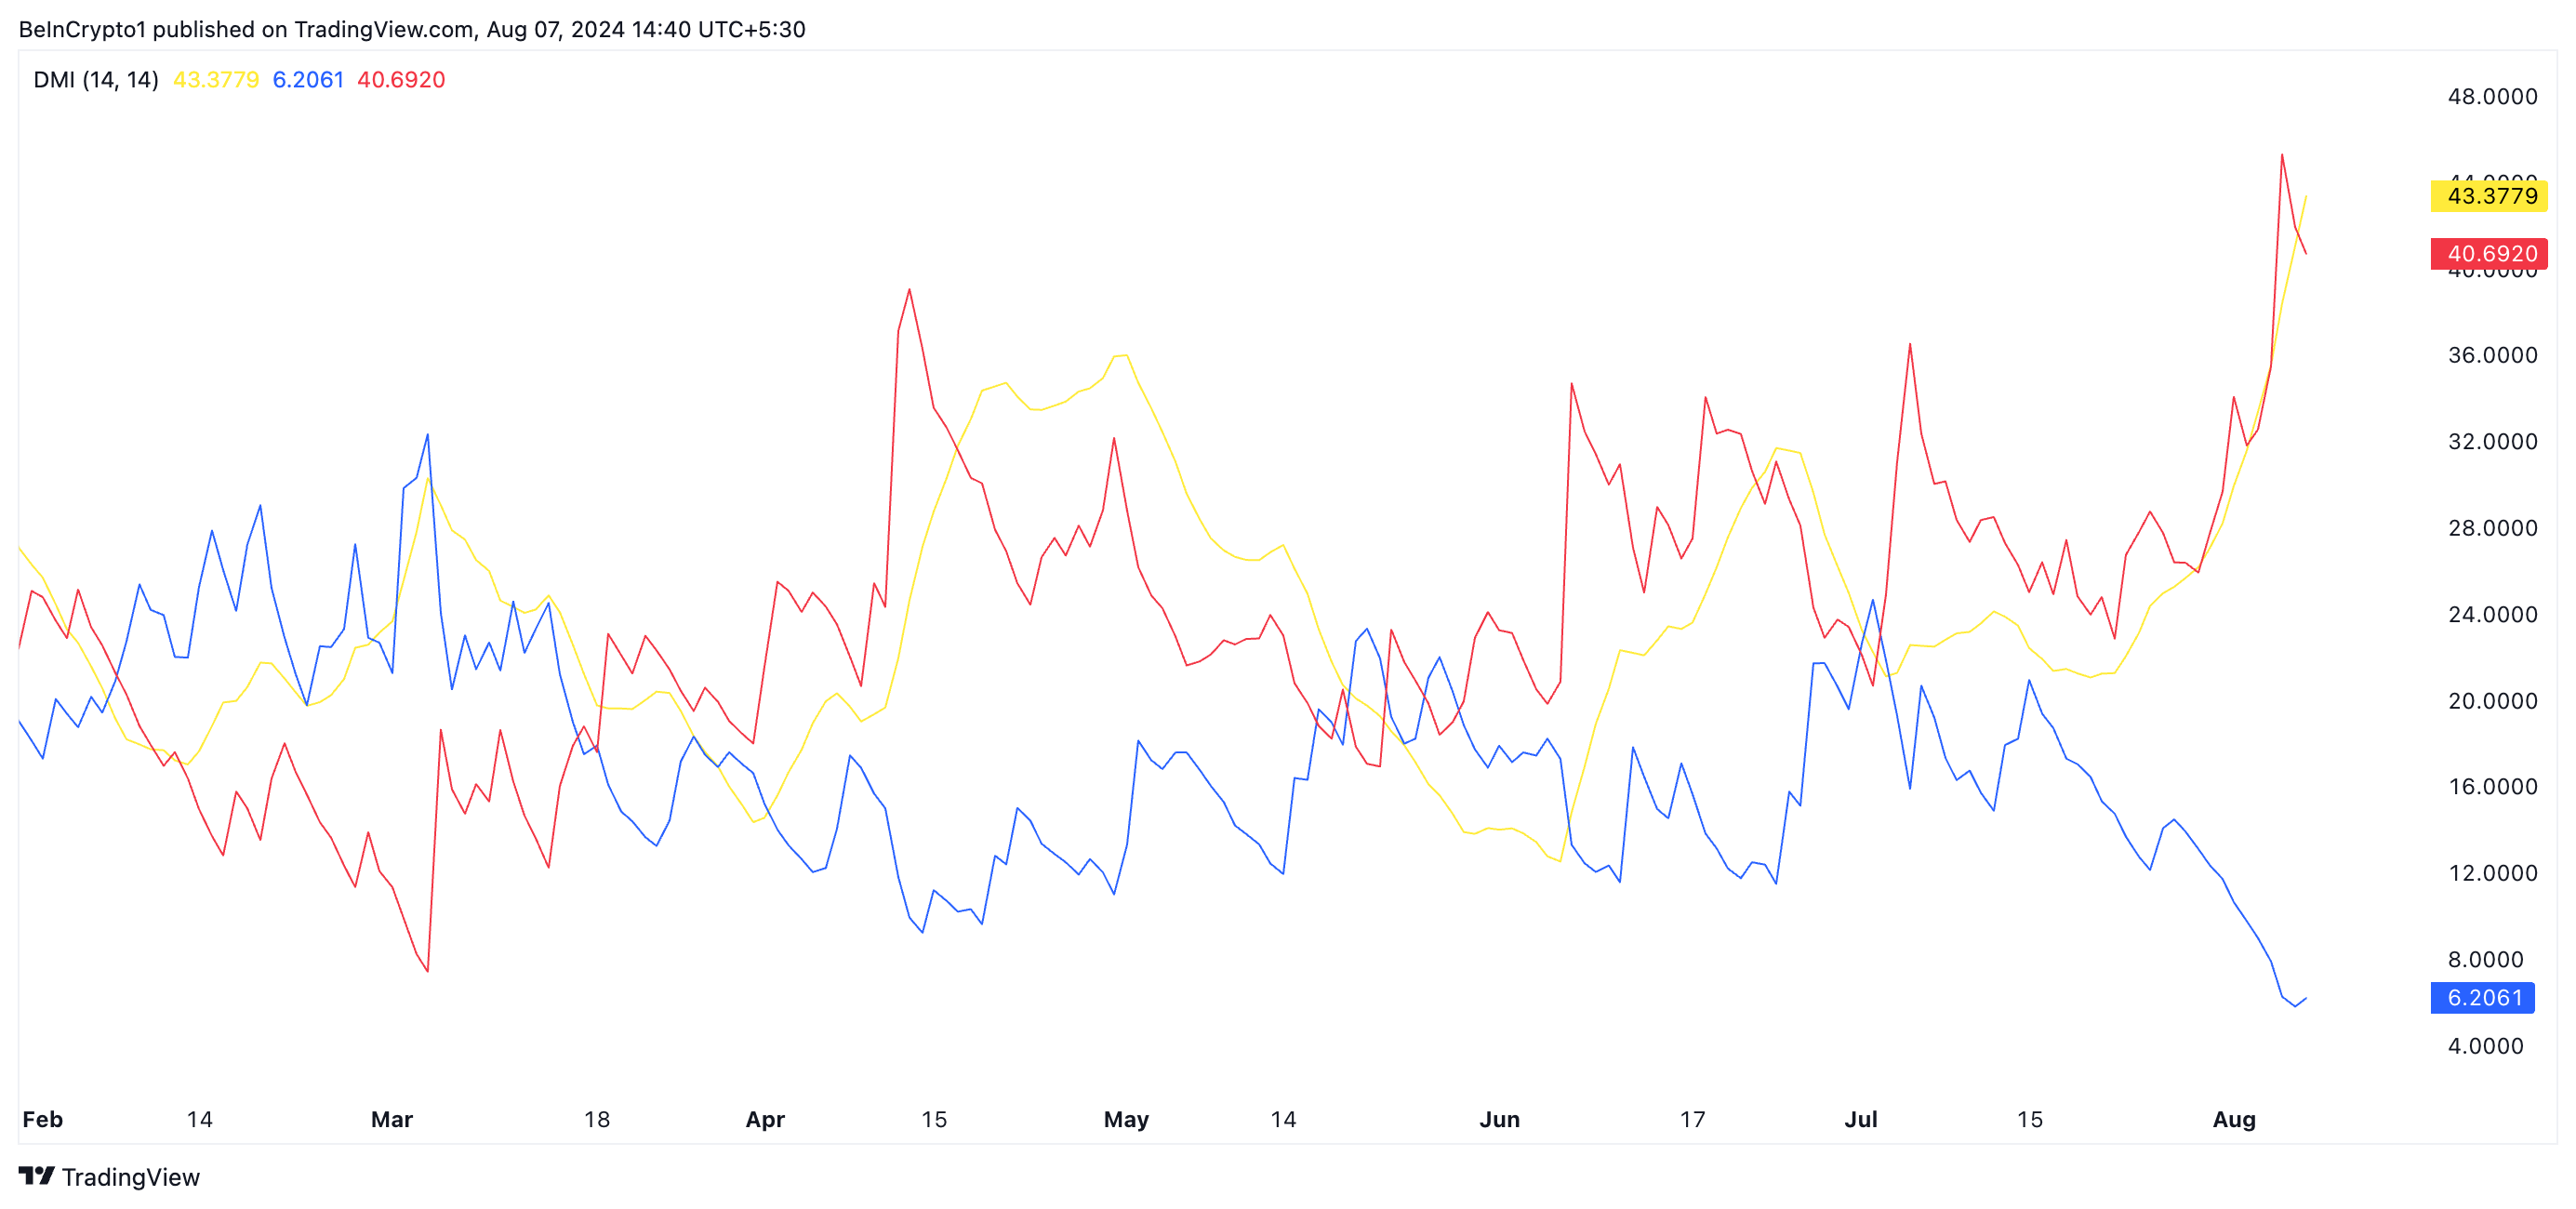
As of this writing, readings from $DOT’s Directional Movement Index (DMI) show its negative directional indicator (-DI) (red) resting above its positive directional indicator (+DI) (blue)
An asset’s DMI measures the strength and direction of its market trend. The downtrend is strong when the +DI line is below the -DI line. This means that sellers have more control over the market than buyers.
The greater the distance between the -DI and the +DI, the stronger the downward momentum. In $DOT’s case, the downtrend is significant as the -DI line is 40.69, while the +DI line is 6.20.
Further, $DOT’s Average Directional Index (ADX) (yellow) is in an uptrend at 43.37. Generally, when an asset’s ADX is rising while the -DI is above the +DI, it indicates that the downward trend is strong and likely to continue.
At press time, $DOT trades below its 20-day exponential moving average (EMA) (yellow) and its 50-day small moving average (SMA) (blue).
An asset’s 20-day EMA is a short-term moving average that reacts quickly to price changes. It reflects the average closing price of an asset over the past 20 days. On the other hand, its 50-day SMA is a longer-term moving average that measures its average closing price over the past 50 days.
Read more: What Is Polkadot ($DOT)?
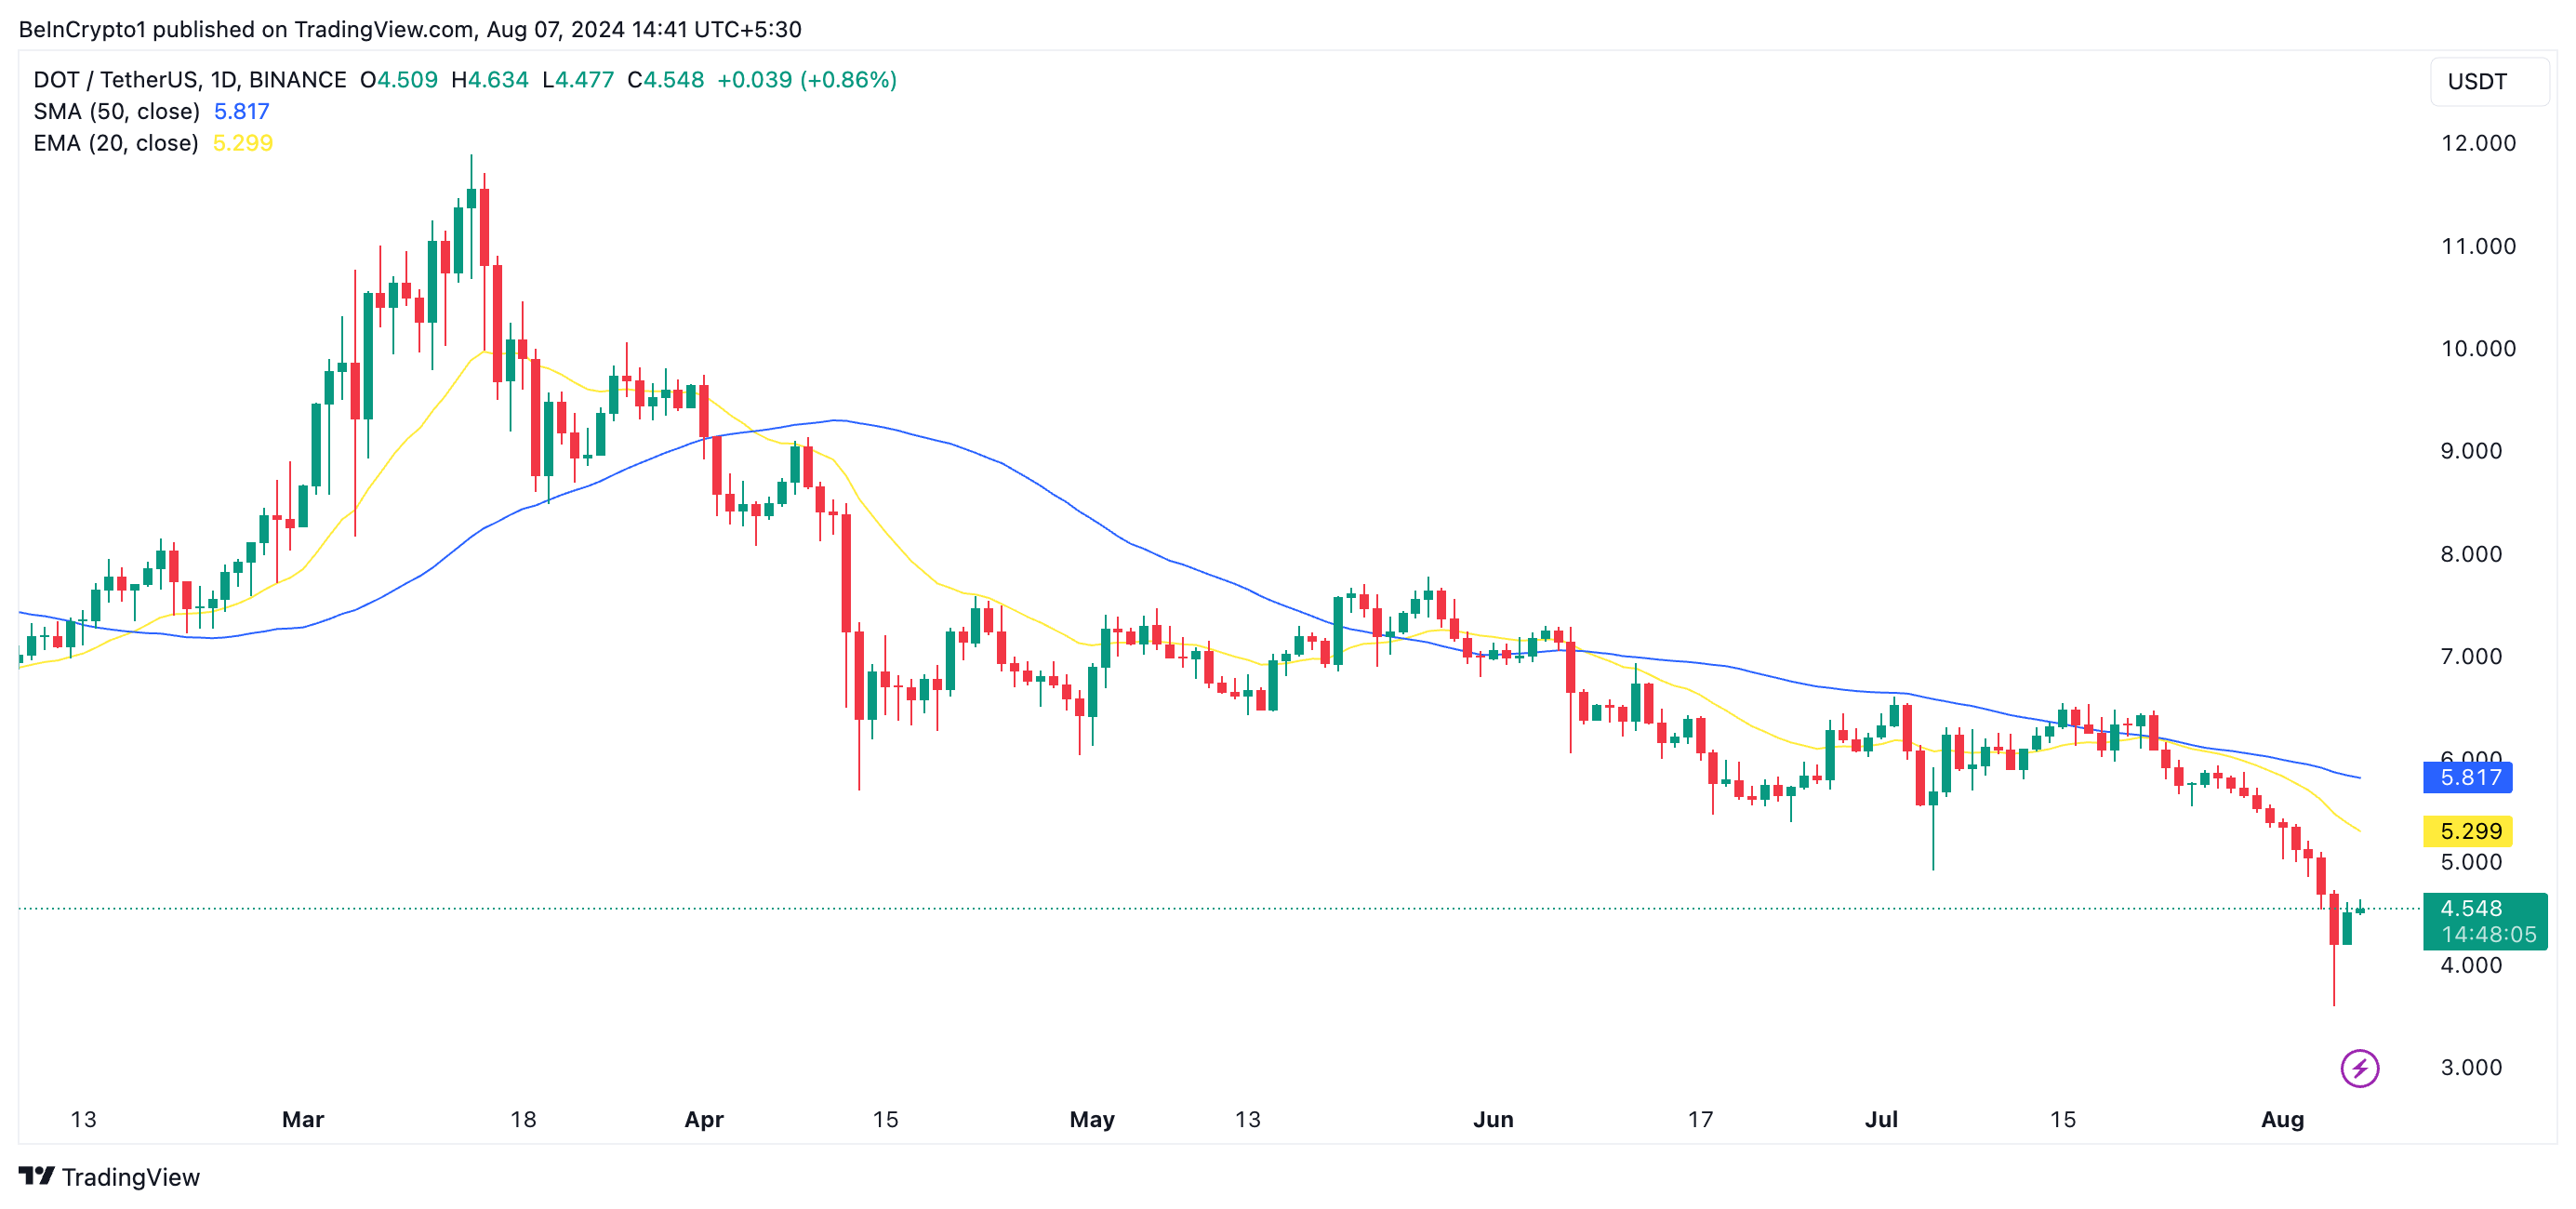
When an asset trades below these key moving averages, it is a bearish signal. It means that short-term and medium-term traders are selling the asset, leading to sustained downtrend pressure.
$DOT Price Prediction: A Rally Above These Averages Is Important
$DOT’s 20-day EMA and 50-day SMA may act as resistance levels. If it tries to rally above them, it may face selling pressure around these averages and resume its downtrend. If this happens, $DOT’s price may fall to the nine-month low of $3.59, which it traded at on Monday.
Read more: Polkadot ($DOT) Price Prediction 2024/2025/2030
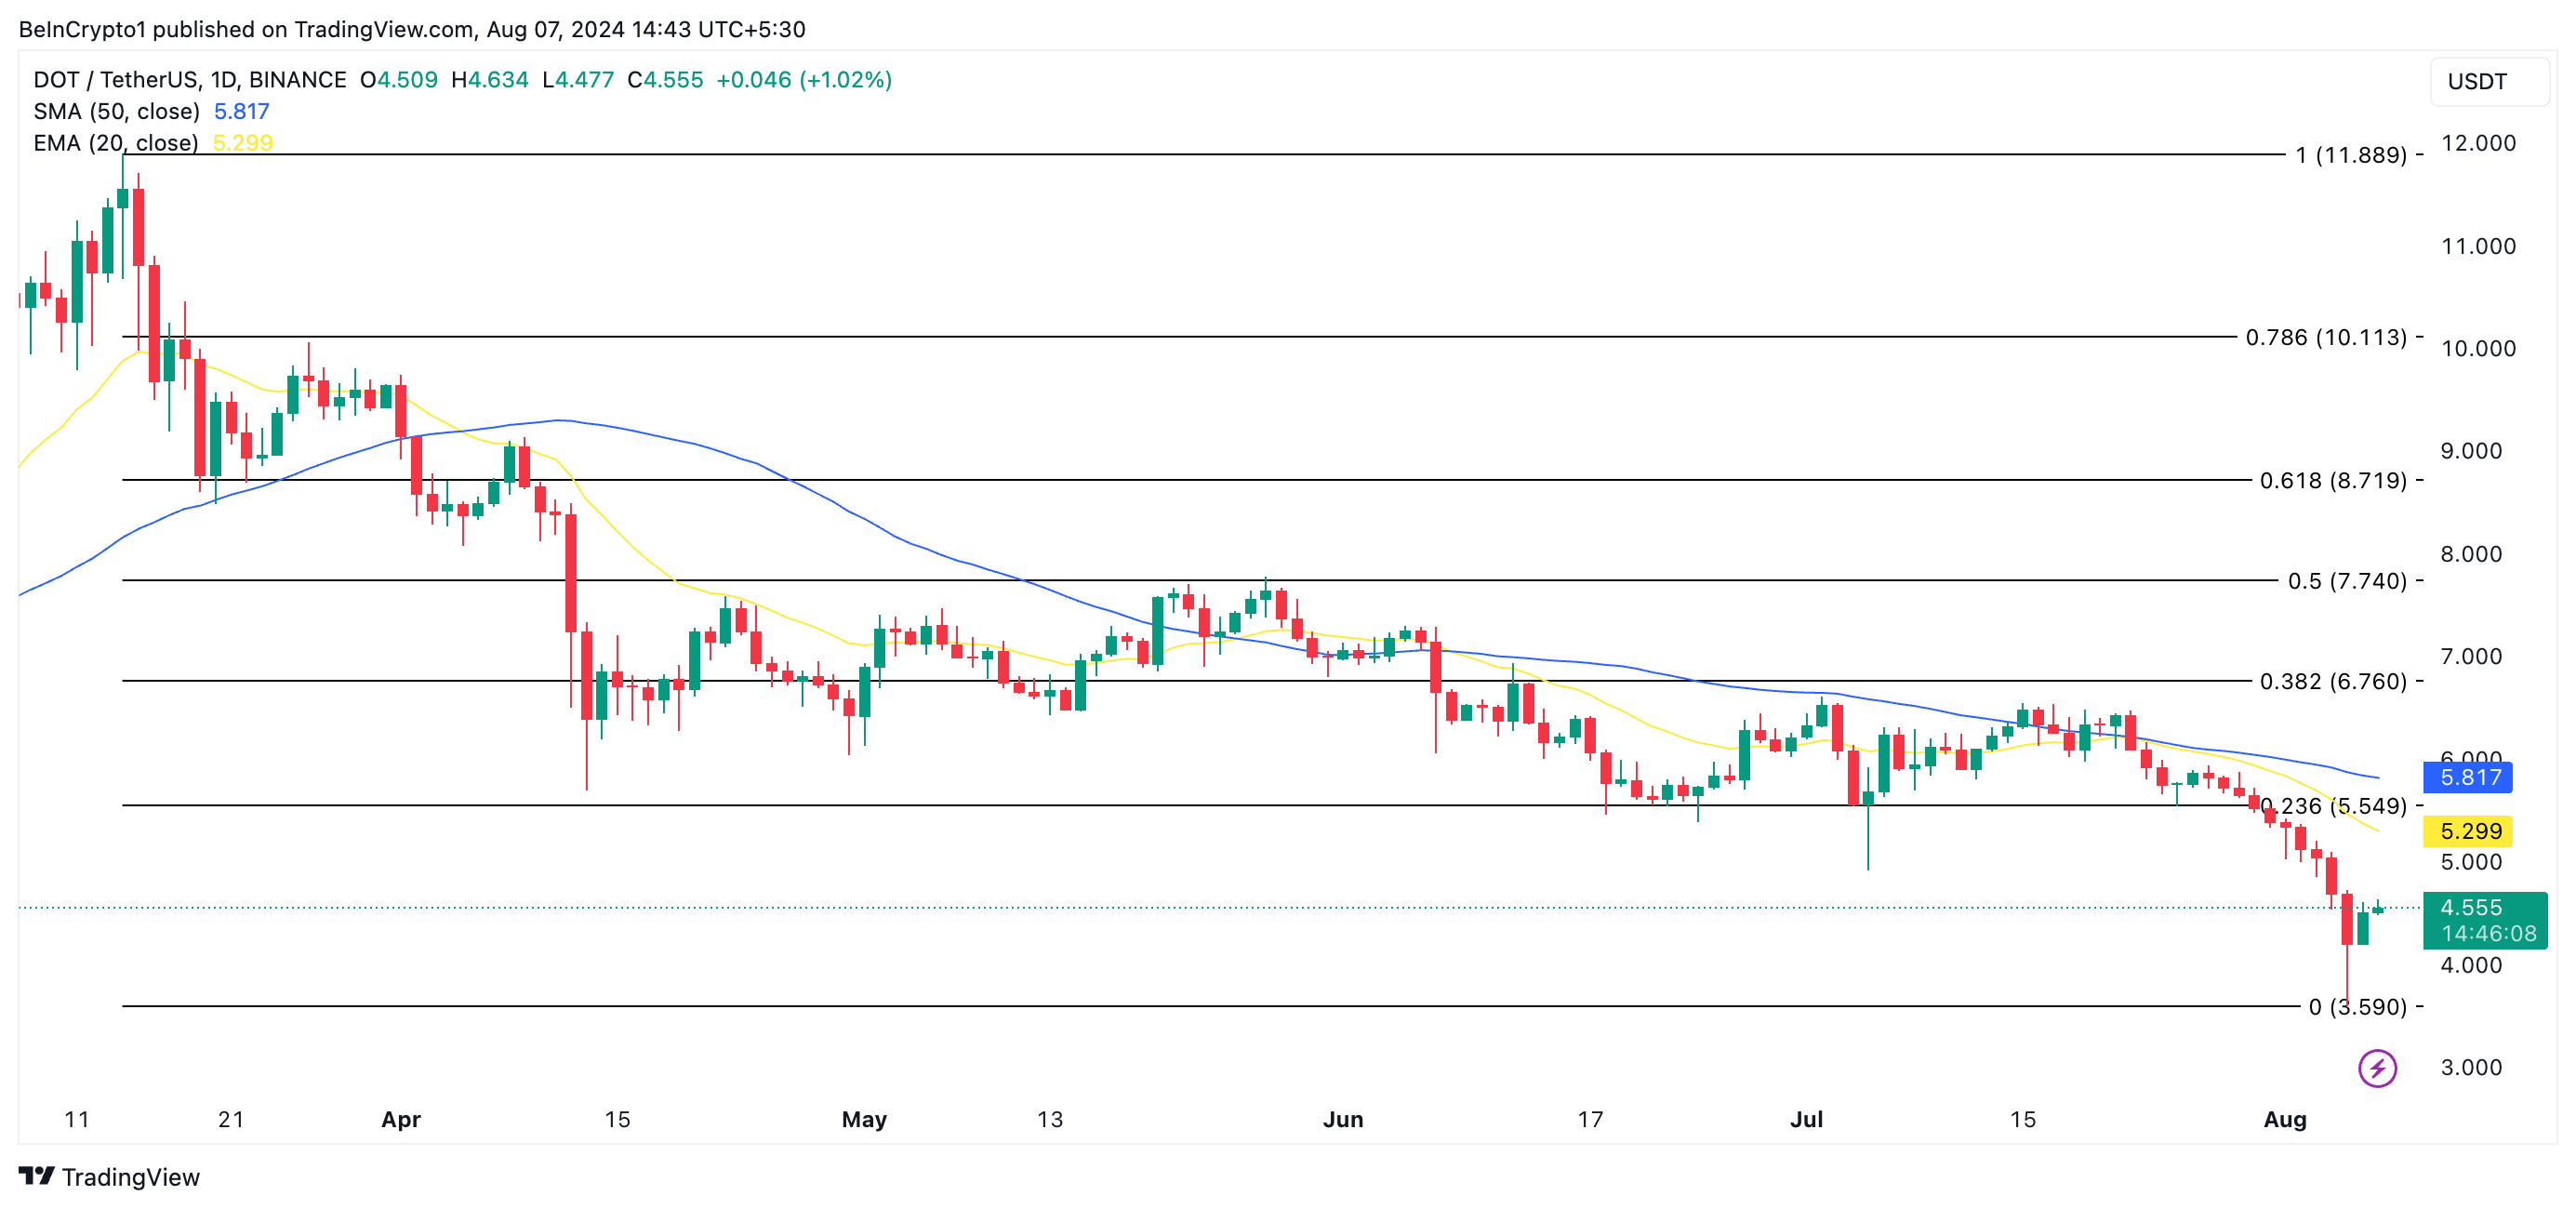
However, if the coin initiates an uptrend and breaks above these moving averages, its price target will be $6.76.