
In the past three weeks, VeChain ($VET) price fell by nearly 29%, most likely influenced by Bitcoin’s deterioration to $61500.
The entire crypto market was in a red sea, which also led its global market cap to plunge. The global market cap reached $2.2 Trillion, with a 4.5% 24-hour loss.
A look at VeChain Impotant Stats
VeChain ($VET) TVL has declined to $534.7K over the last few months. This showed a decline in the project investment and the investors’ confidence.
Meanwhile, the token’s total supply was 85.9 Billion $VET, of which 93.3% was circulating in the market (at press time). As per the rich list, VeChain’s top 10 holders held 41.43% of the total floating supply.
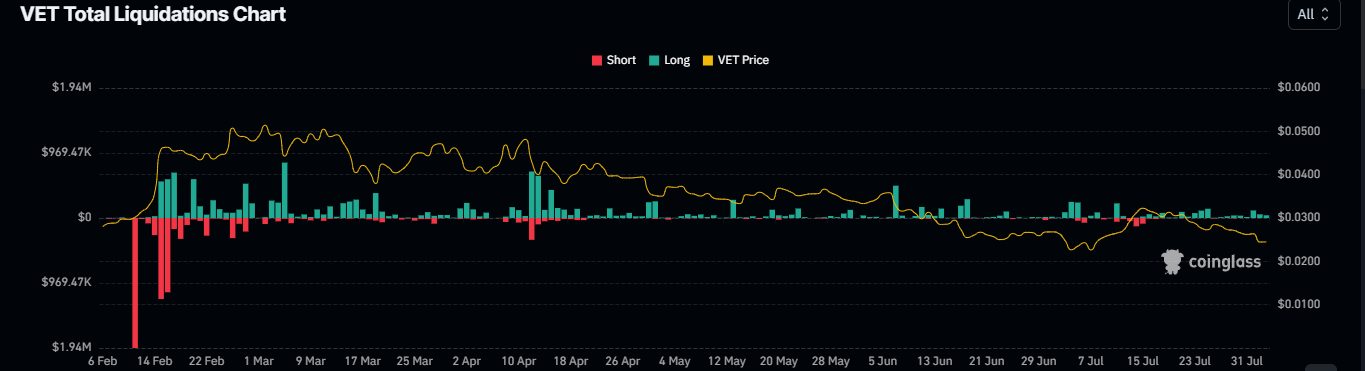
The bearish dominance facilitated higher long liquidations. As of writing, the recorded long liquidation was worth $77.10K. On the other hand, only $1.78K shorts were liquidated in the last 24 hours.
Moreover, VeChain’s market cap dominance was 0.08%, which exhibited its strong presence. Also, the token’s market cap rank was 42, according to CoinMarketCap.
The VeChain token’s market cap witnessed a slight decline of 4%, which resulted in a market cap value of $1.986 Billion.
Recorded $ATH & ATL in VeChain($VET)
According to TradingView, VeChain ($VET) hit its all-time low (ATL) of $0.001495 in mid-March 2020. Since then, its current price has surged by 2000%.
On the other hand, the all-time high ($ATH) for $VET was $0.2664, recorded in mid-April 2021. The current market price (CMP) has dropped by nearly 90% compared to this peak.
VeChain Price Behaviour Over the Daily Chart
Over the last five months, VeChain ($VET) has experienced consistent profit-taking, which resulted in a 56% decline in its price. Meanwhile, this downward trend has led to a spree of lower lows, followed by horizontal support levels.
A significant change in character level was noted at $0.033, marking a crucial point for market participants.
Despite challenges, $VET price has pierced through bear sentiment for a brief rally from the $0.02395 support level. However, it could not sustain the higher level gains at $0.033, which led to a renewed bear pressure.
This failure to maintain the breakout has indicated the continued volatility in $VET. Additionally, It has shown potential further downward pressure in its price in the near term.
Similarly, the price has traded below the 50-day and 200-day EMAs for longer. A death cross followed this in the EMA bands.
Moreover, the indicators depict the bearish angle, as the MACD and the signal line also developed a death cross. Both are signaling negativity. The histograms on the charts were negative at 0.00052, indicating a bearish sentiment.
The RSI fell below the 50-level and the 14-day SMA, remaining below these levels for a prolonged period at 35.38. Additionally, its support levels for VeChain ($VET) are at $0.020 and $0.016. At the same time, resistance levels are at $0.033 and $0.043.