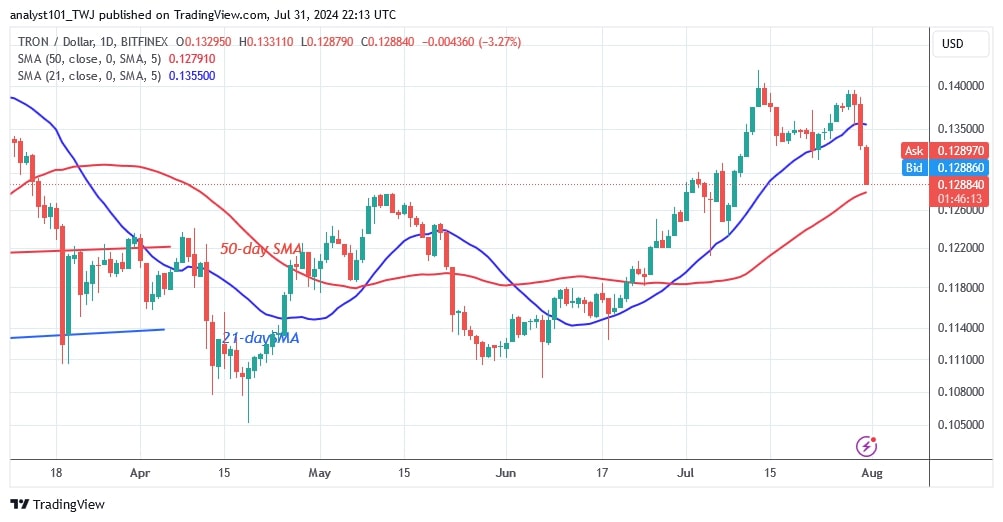
The price of TRON (TRX) has risen twice to the resistance level of $0.14, but was unable to break through. Price analysis by Coinidol.com.
TRON price long-term prediction: bearish
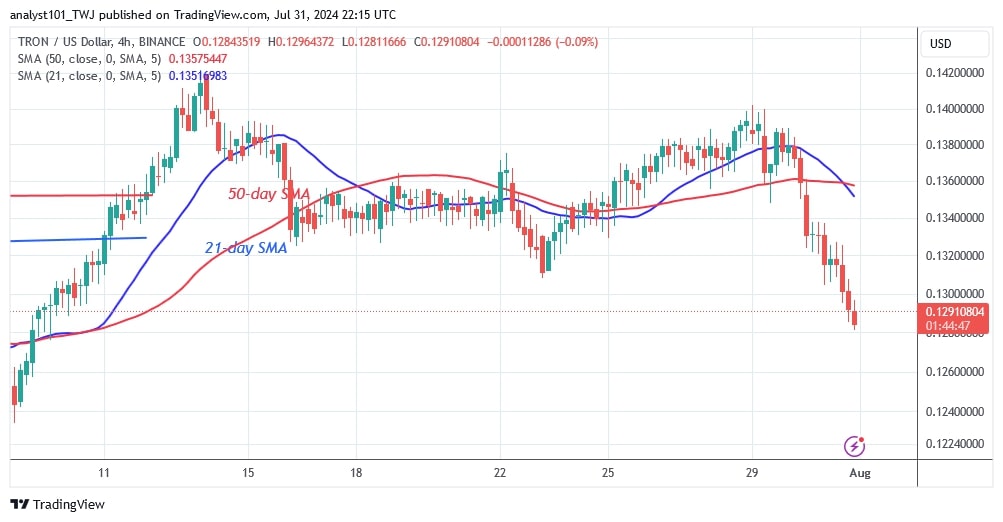
TRON was pushed back after testing the resistance level for the second time. The altcoin fell well below the moving average lines but stalled near the 50-day SMA support. In other words, TRON has fallen from a high of $0.139 to a low of $0.128. The decline has moderated and TRON is trading above the 50-day SMA support or the resistance of the 21-day SMA. Nevertheless, a further negative move in the coin seems unlikely.
However, should the bears breach the 50-day SMA support, the market would plunge to the next support level of $0.122.
TRX price indicator reading
After the recent decline, TRON has retraced and is now between the moving average lines. It has experienced bearish exhaustion. TRON will rise if the 50-day SMA support holds. The market will rise to the resistance level of the 21-day SMA.
Technical Indicators
Key supply zones: $0.13, $0.14, $0.15
Key resistance zones: $0.10, $0.09, $0.08

What is the next step for TRON?
After the recent downturn, TRON has fallen between the moving average lines. The altcoin has reached bearish exhaustion. TRON will rise if the 50-day SMA support holds. The market will move up to the resistance level of the 21-day SMA. The uptrend will start if the 21-day SMA resistance is broken.

TRX continued its uptrend and remained above the 21-day SMA on July 22, as reported by Coinidol.com before. Last week TRON was trading at $0.135.
Disclaimer. This analysis and forecast are the personal opinions of the author. They are not a recommendation to buy or sell cryptocurrency and should not be viewed as an endorsement by CoinIdol.com. Readers should do their research before investing in funds.
 coinidol.com