- Solana dropped almost 10 percent to kick off bearish outlook for the crypto market
- Price plunged as low as $177.04 after consecutive increments before
- Trading volume showed dominant seller action with 63 percent rise
Solana price analysis for the day shows grim reading for the token, as price topped a declining crypto market with a 10 percent dip. SOL reached as low as $177.04, moving below the 20 and 50-day Exponential Moving Averages (EMAs) in the process. Meanwhile, dominant seller action was displayed by a rising trading volume that upped more than 63 percent. Over the current bearish outlook, it could be expected that price may slide towards the $161 support floor, from where buyers will initiate the next push.
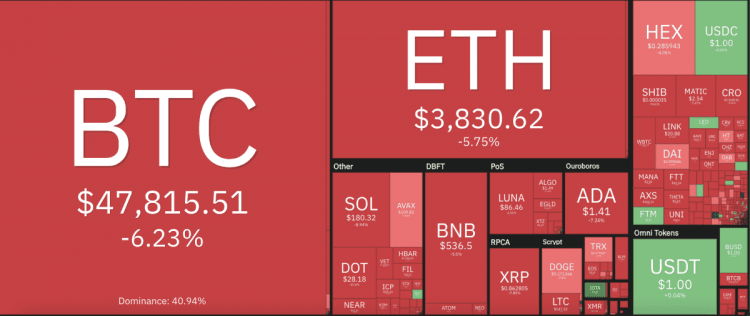
The larger crypto market bled heavily over the day, led by Bitcoin’s 6 percent decline down below $48,000. Ethereum also lost further ground on the $4,000 mark with a near 6 percent dip. Among Altcoins, Cardano and Ripple dropped 7 percent each, with Polkadot plunging 10 percent to sit at $28.14. Litecoin declined 8 percent, while Dogecoin fared somewhat better, only dropping 3 percent on the day’s trade.

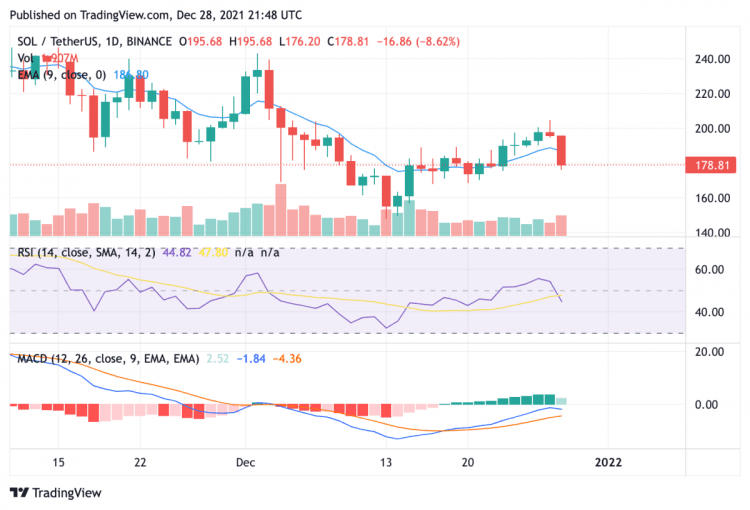
SOL/USD 24-hour chart: Evening Star pattern shows shift in trend
The 24-hour chart for Solana price analysis shows appearance of an Evening Star pattern that indicates a change in trend for the token. After continuous increments since December 23, price reached as high as $199.21. However, the day’s trade has seen losses accumulate with price set to go further south from the current position of $178.81. The Relative Strength Index (RSI) shows low market valuation with a reading of 44.82, while the Moving Average Convergence Divergence (MACD) curve is sharply moving downward towards its neutral zone below the 0.00 mark.

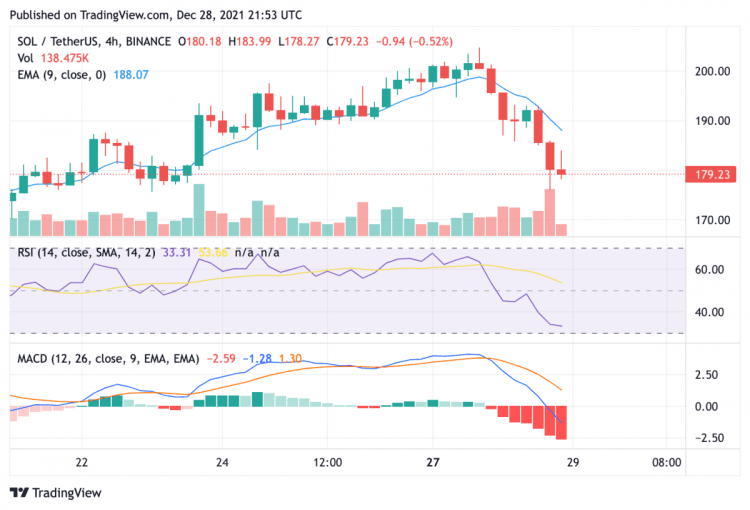
SOL/USD 4-hour chart: Price headed towards first support of $176
The 4-hour chart for the SOL/USD trade pair shows significant decline made over the past 4-hour trading sessions, with price seemingly in free fall. After conceding the first line of defence at $187, SOL took some respite at the 50 twelve-hour simple moving average (SMA) of $183. The next support will be offered at $176, from where price would head towards the 78.6% Fibonacci retracement level of $172 if selling pressure continues.

Solana price analysis: Conclusion
Major technical indicators and price action over the past 24 hours suggest that the token is set for a continued bearish run that could plunge price as low as $161. Over the next trading sessions, multiple support points will be tested and if SOL fails to bear seller pressure price could move towards the October 10 high of $152. However, if a flurry of buy orders occur, Solana price could tag back towards the 61.8% Fibonacci retracement at $190 and from there towards $203.
 cryptopolitan.com