Ethereum Classic (ETC) was bullish intraday, it gained over 5%, exchanging hands at $24.76. Positive ETF news is set to propel Ethereum and its closely related coins, such as Ethereum Classic (ETC).
The U.S. SEC has waved the green flag for ETH spot ETFs. The ETFs are set to begin trading on the morning of July 24. Bloomberg senior ETF analyst @Eric Balchunas shared the news of the regulator’s approval on X.
It’s official: Spot Eth ETFs have been made effective by the SEC. The 424(b) forms are rolling in now, the last step = all systems go for tomorrow’s 930am launch. Game on. pic.twitter.com/9MaBDBA8co
— Eric Balchunas (@EricBalchunas) July 22, 2024
For the curious, it was a fork of ETH, a blockchain that emerged from a split with Ethereum in 2016.
Its market cap has surged more than 5% to $3.665 Billion. Its trading volume jumped exponentially by more than 208% to $533.65 Million, signaling significant buying activity.
The volume-to-market cap ratio, followed by 24-hour activity, indicated high liquidity in the ETCmarket, with a ratio of 14.26%. Based on the market cap, it is ranked 26th among the top 100 on CoinMarketCap.

Meanwhile, market sentiments pointed to 71 (greed) per the Crypto Fear & Greed index. This bullish sentiment looked geared for the spectacular surge in Ethereum’s price and the Ethereum branded assets.
Ethereum Classic On-Chain Overview
Per the 2miners website, the number of miners online has been 5008, with the network difficulty at 2.37P. Meanwhile, the block reward has been at 2.048 ETC, where the mining block count reached 20343711.

The mean rate at which miners have been solving hashes has risen, reaching 172.57. Meanwhile, all fees paid to miners have reached $43.3, and miner revenue has surged to $307K.
Also, the socials have enormous followings, as Reddit has 66.52K Million subs, and X has 17.80K Million followers.

Tokenomics: 148.03 million ETC (70.26%) of the total supply of 210.7 million ETC have been in circulation. In contrast, the fully diluted value is $5.194 Billion.

Based on these stats, the ETC holders data indicated that the top 100 hold 52.88% of the circulation. On the other hand, the total number of holders stands at 2.445 million.
Ethereum Classic (ETC) Price Structure on Daily and Weekly Overview
Over the weekly chart, most of the price structure was in the broad range of $12-$46. Except in 2021, when the price structure peaked out of this range, an ATH was registered at $175.
Overall, 70% of the price formation was below this range, and 30% was out of the range.
As per the TradingView (ETC/USD-COINBASE), the price has traded nearly 85% down as of writing. Based on the recent surrounding spot Ether ETFs will trade soon. The Ethereum branded assets, like ETC, could skyrocket. Thus, the probability appears higher that it could break out of the range.

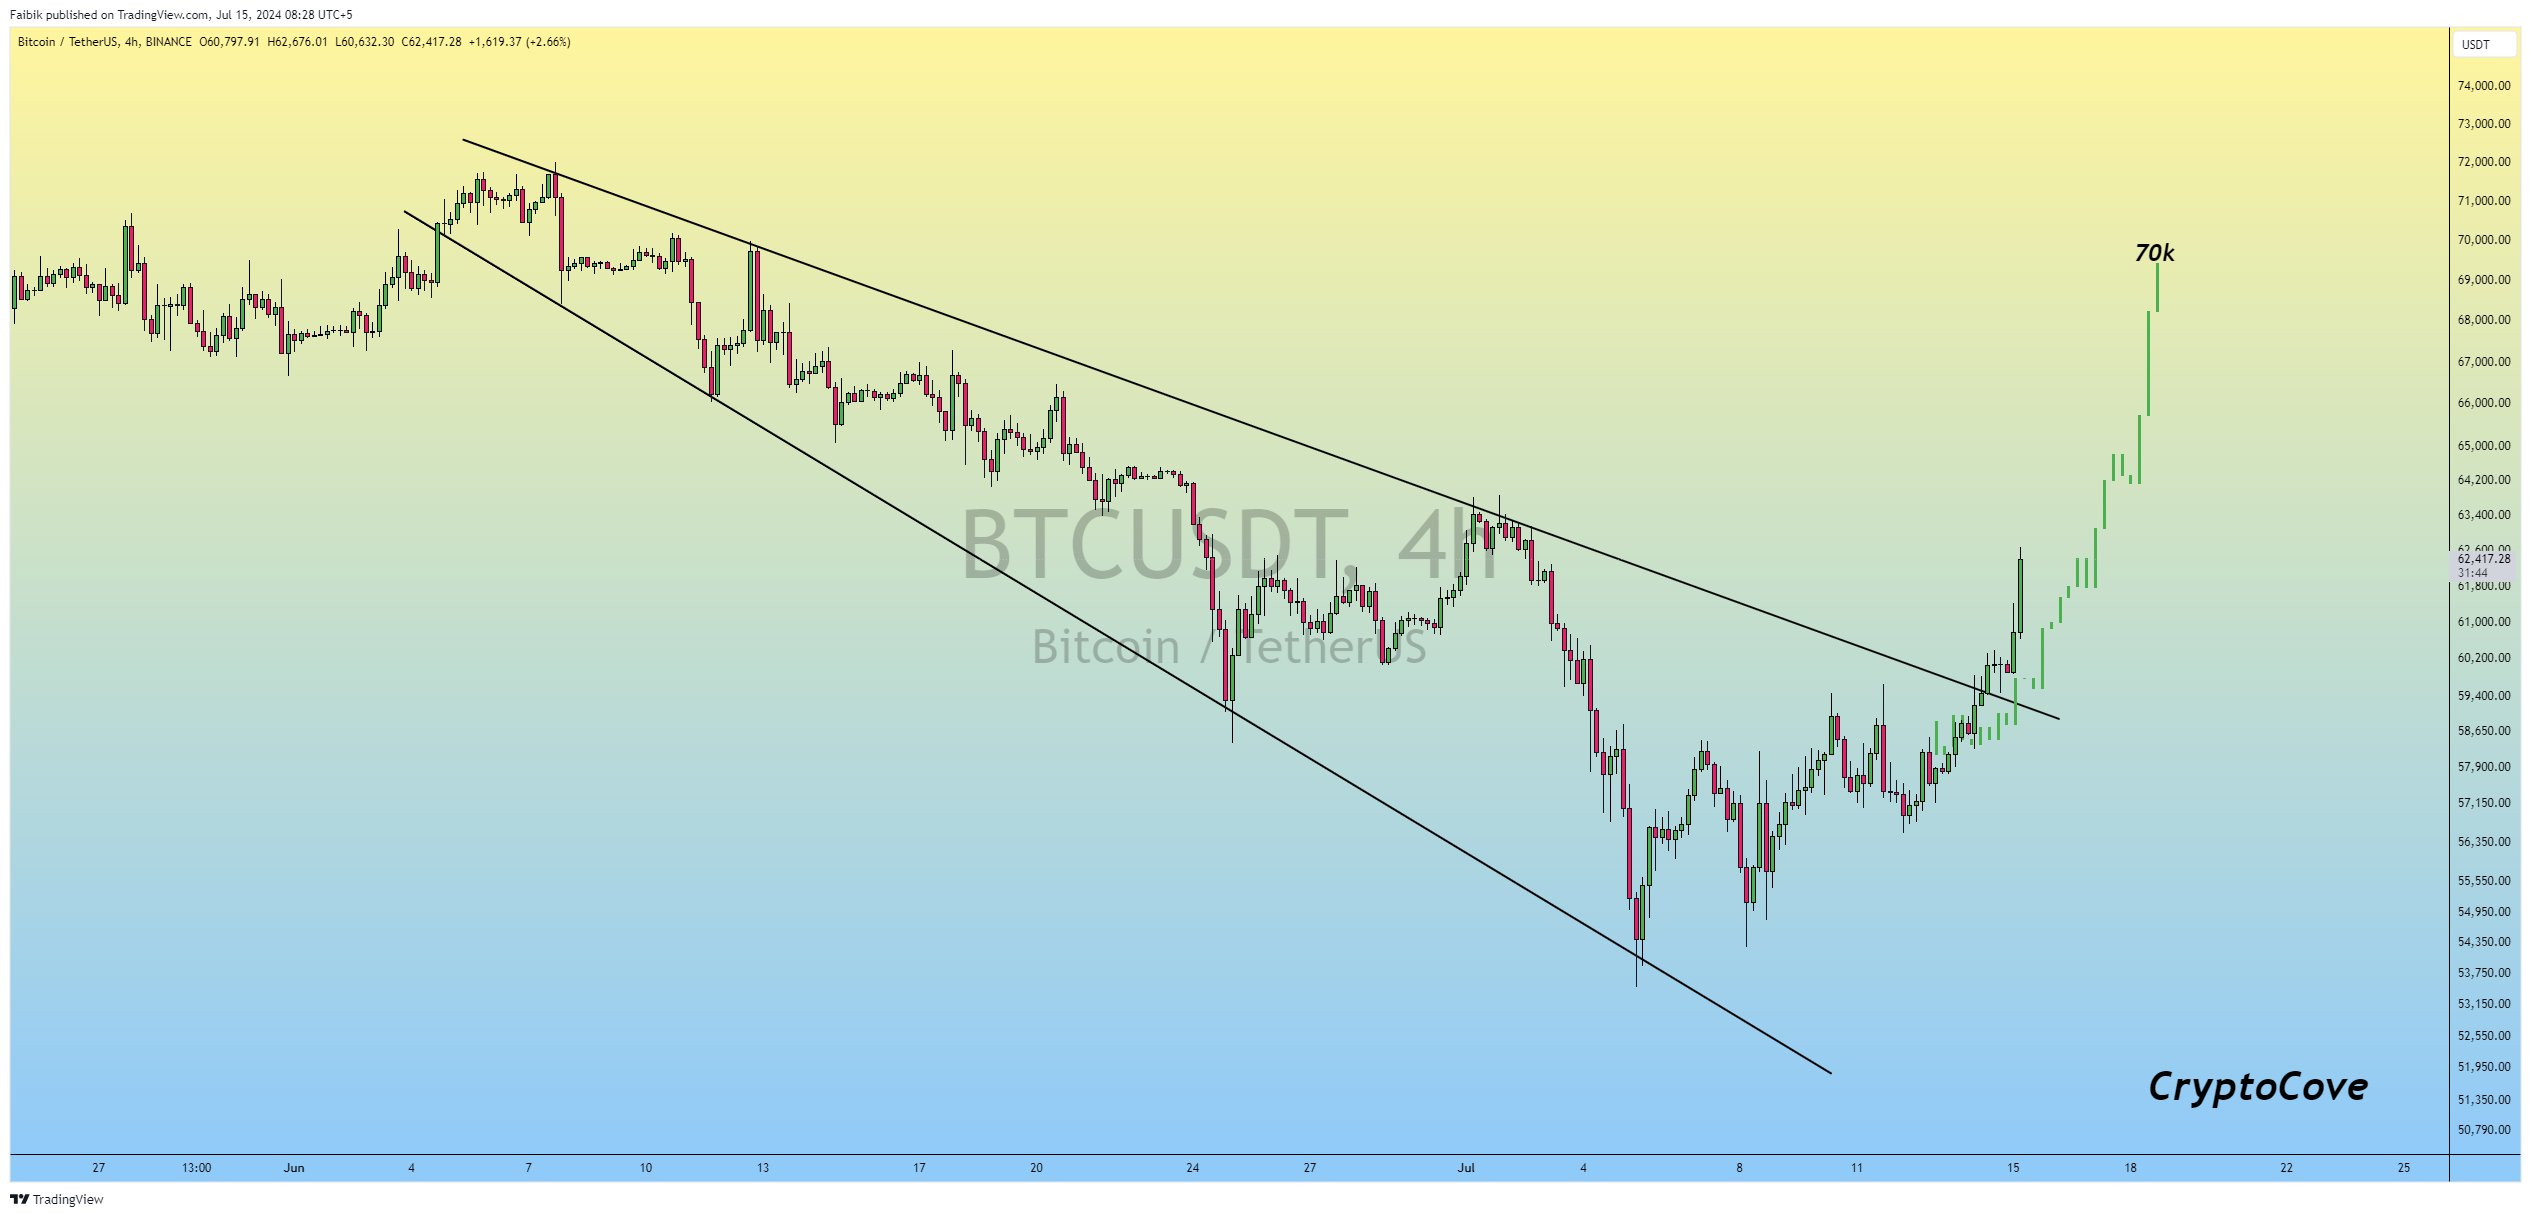
Over the daily chart, the price resonated with BTC’s bullish effect on the broader market. After the deterioration ended, ETC sustained on the same day as BTC (July 5th). In the last 18 days, the price grew over 30%.
ETC has breached the 50-day EMA band and has been approaching the 200-day EMA. Meanwhile, the MACD formed a bullish cross with a histogram at 0.39, and RSI flashed at 58.33.
Therefore, the resistance levels on the daily time frame are $28.52 and $34.28. Failure to ascend will give the seat to bears, and they could eye for $21.90 and $18.45 support levels.
ETC surged 5% on news of ETH ETF approval, and trading volume spiked. Market cap reached $3.6 Billion, reflecting bullish momentum. Technical indicators indicate potential for further gains, but resistance levels loom.
 thecoinrepublic.com
