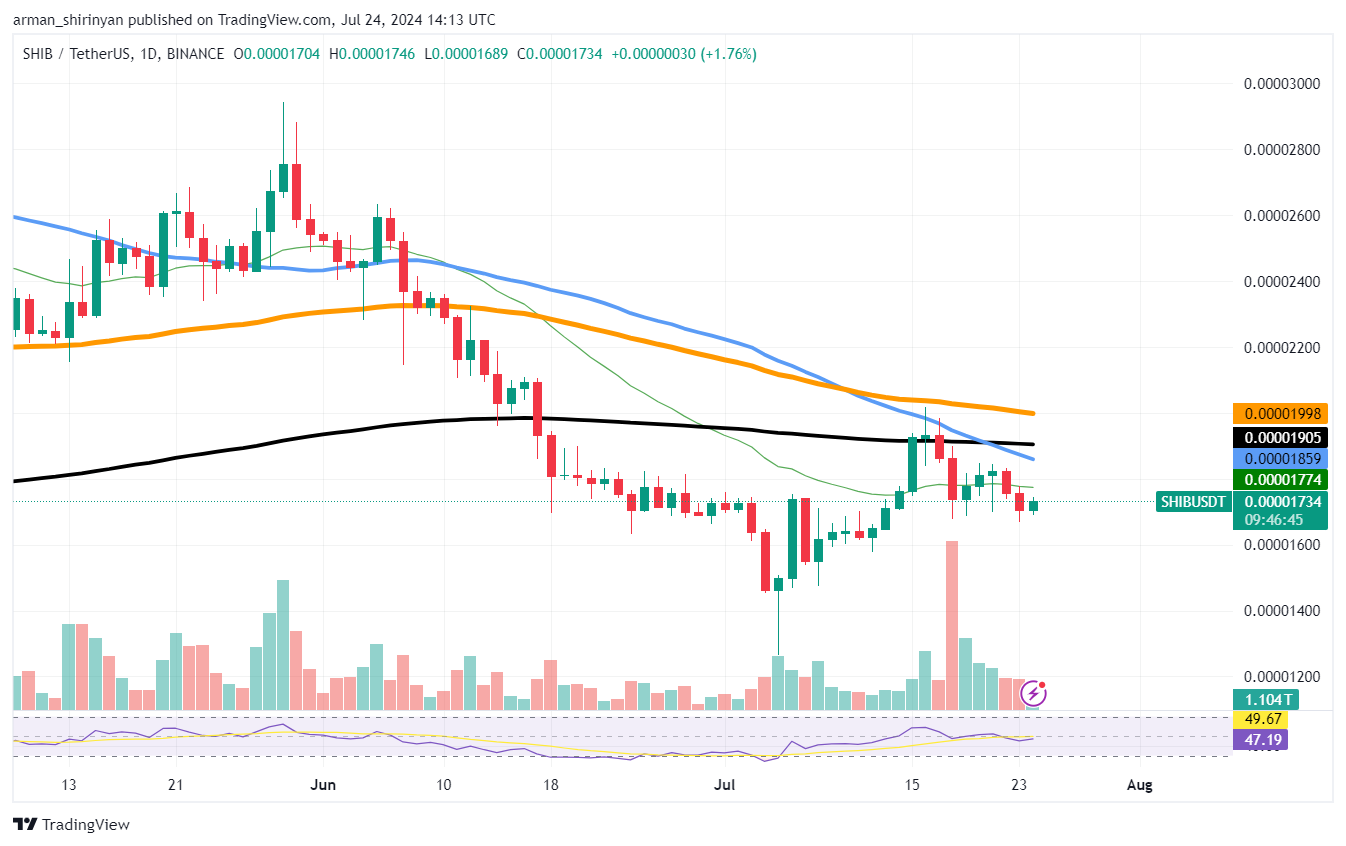
Since the 200 EMA resistance level was not broken, Shiba Inu is currently going through a difficult time. If SHIB does not gain enough momentum, it will probably break below important moving averages and may even retrace below $0.000017. SHIB is currently trading at $0.00001721, and its inability to break above the 200 EMA is a strong bearish indicator.
The inability to break above this level indicates that there is not much buying pressure, as it has proven to be a strong resistance. Both the blue 50 EMA and the orange 100 EMA are trending lower, suggesting that short- and medium-term sentiment is still negative.

SHIB is having difficulty finding support above the 26 EMA, as evidenced by the most recent price action. This dearth of backing emphasizes the token's pessimistic future. The next support level to watch is roughly $0.000016, if SHIB keeps falling and breaks below the important moving averages. In the event that SHIB breaks below this level, a further retracement may occur.
It is evident that there is more selling pressure than buying pressure when the RSI indicator is centered around 46, which is below the neutral 50 level. This lends more faith to the short-term bearish scenario for SHIB.
Ethereum ETFs enter market
After the successful launch of spot Bitcoin ETFs, the Ethereum ETF launch was one of the most anticipated events of the year. It is safe to say that the launch was a huge success and brought in a sizable amount of money from institutional investors. But for these reasons there was a nearly bearish impact on the price.
The excitement and $1.1 billion in trading volume during the first few days did not translate into a corresponding increase in Ethereum's price. The $106 million net inflow, as well as impressive numbers from ETFs like Bitwise's ETHW ($204 million) and BlackRock's ETHA ($266 million) highlighted the presence of strong interest.
This sudden change in price was caused by a number of factors. First of all, there is a chance that the enormous excitement and buildup for the Ethereum ETF launch contributed to a buy-the-rumor, sell-the-news situation.
Once the ETF launched, investors who had amassed ETH in anticipation of the launch may have sold their holdings to profit. Second, although the introduction of the ETF attracted attention from institutions, it also brought attention to the dearth of new retail investors joining the market.
Toncoin under pressure
The bullish narrative surrounding Toncoin appears to be coming to an end as the asset falls below $7 and approaches a crucial $6 support level that is backed by the 100 EMA. To date, Toncoin has been unable to sustain its optimistic momentum, trading at roughly $6.20. There is less buying pressure, as seen by the recent drop below the psychologically important $7 threshold.
With its alignment with the orange 100 EMA, the $6.60 level is a critical support level, and should it be broken, it may indicate additional downside. Bearish sentiment is reinforced by the 200 EMA and 50 EMA.
The neutral 50 level is being hovered over by the RSI indicator, which is indicating a slight bias toward buying pressure. The indicator is currently at 43. This lends even more credence to the short-term bearish outlook for Toncoin. With unfavorable technical indicators, Toncoin's demise is still possible.
The 100 EMA-reinforced $6.60 support level is still a crucial area to keep an eye on. It is possible for Toncoin to recover and reclaim some of its lost bullish momentum if it can stay above this level. The asset testing may, however, move to lower levels if this support is not maintained. The next significant support is located around $5.20.
 u.today
