XRP price may experience a rally to $1.16 or a substantial surge to $91, influenced by three bullish indicators observed on the monthly chart.
The first indicator shows the XRP price achieving a monthly close above the upper Bollinger Band. Meanwhile, in the second indicator, XRP experiences a significant decline in the Historical Volatility metric.
The third indicator involves a tightening of the Bollinger Bands, indicating reduced volatility. Notably, for a significant breakout to occur, these three indicators must occur in a progressive manner.
XRP Historical Data
A convergence of the three indicators was first observed in early 2017. Notably, in February 2017, the Historical Volatility metric dropped to a low of 123. This collapse coincided with a significant tightening of the Bollinger Bands, confirming the slump in volatility.
A month later, in March 2017, XRP recorded a monthly close above the upper Bollinger Band. The token ended the month at $0.02140, while the upper Bollinger Band stood at $0.01410. Interestingly, following this occurrence, XRP surged 15,544.1% from the March close of $0.02140 to a new all-time high of $3.31 in January 2018.
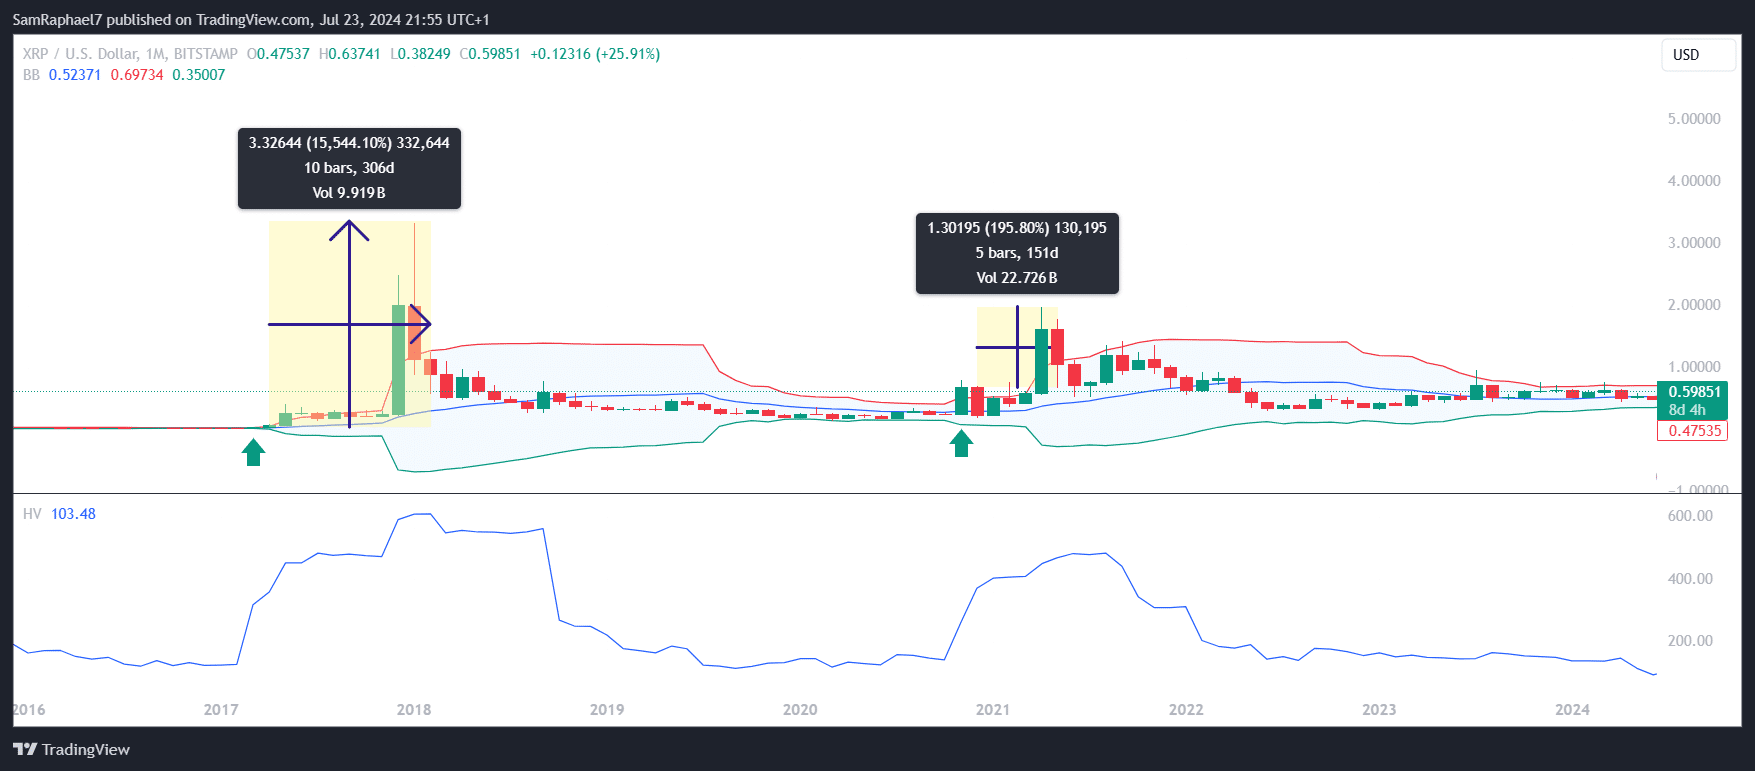
The pattern reappeared in late 2020. During this period, XRP’s Historical Volatility dropped to a new low of 138.22 in October 2020 as the Bollinger Bands tightened. A month after this, XRP recorded another monthly candle close above the upper Bollinger Band.
Specifically, XRP closed November 2020 at $0.6647, while the upper Bollinger Band stood at $0.4992. Shortly after this second occurrence, XRP price rallied 195.8%. This rally involved a surge from the November close of $0.6647 to a high of $1.9669 in April 2021.
While both occurrences led to significant price increases, the first rally was much larger due to its duration, lasting ten months. In contrast, the second rally lasted just five months.
XRP Price Eyes $1.16 or $91
Currently, XRP’s Historical Volatility has dropped to an all-time low of 102.93, the lowest ever recorded. In addition to this, the Bollinger Bands have also tightened significantly, indicating reduced market volatility.
These conditions mirror those seen prior to previous surges. Given that XRP is currently on a bullish trajectory if this trend continues into August, XRP price could close the month above the upper Bollinger Band, potentially setting the stage for another significant rally.
Depending on the duration of the rally, XRP could potentially increase by as much as 15,544% or a more modest 195%. A 15,544% rise from the current price of $0.56 would result in a new all-time high of $91. Conversely, a 195% increase from the current price would elevate XRP to $1.16.
The current market conditions present two factors that could cause XRP to take the 15,544% rally. One of these factors is the possible end of the SEC lawsuit, which is already in the remedies phase at press time. Second, the apex of XRP’s rally might align with the peak of the ongoing bull run.