
Bittensor ($TAO) saw buyers produce a bullish spell on the daily chart from July 7th, 2024, reflecting over 65% growth in the last two weeks. Price sustained at a crucial demand zone before rising.
As of writing, the struggle to propel higher continued with a slight halt taken in the course, as the 200-day EMA band acted as a hurdle that needed to be cleared for extraordinary gains to pop out.
Bittensor ($TAO) Statistics In Detail:
According to CoinMarketCap, $TAO spot trading volume stands at $60.709 Million. The market cap is $2.323 Billion. Meanwhile, the liquidity is weak at (2.61%), which could indicate market stability. Investors should be cautious before stepping in (DYOR).
However, despite the weak liquidity, in terms of market cap, $TAO ranked 44th crypto among the top 50 cryptocurrenciess on CoinMarketCap.
Bittensor has given great returns to its investors, which exceeds over 1500%, peaking at $755 (ATH) from October 2023 to March 2024. However, it was followed by profit booking, which loosened around 70% of its growth.
Despite the fall, $TAO/USDT: MEXC displayed that by mid-May 2023, it was at an all-time low level. The price is nearly 900% higher.
According to tokenomics, 7.092 Million $TAO (33.78%) of the supply is in circulation out of the total supply of 21.0 Million $TAO. Meanwhile, the FDV, as of writing, stands at $6.875 Billion.
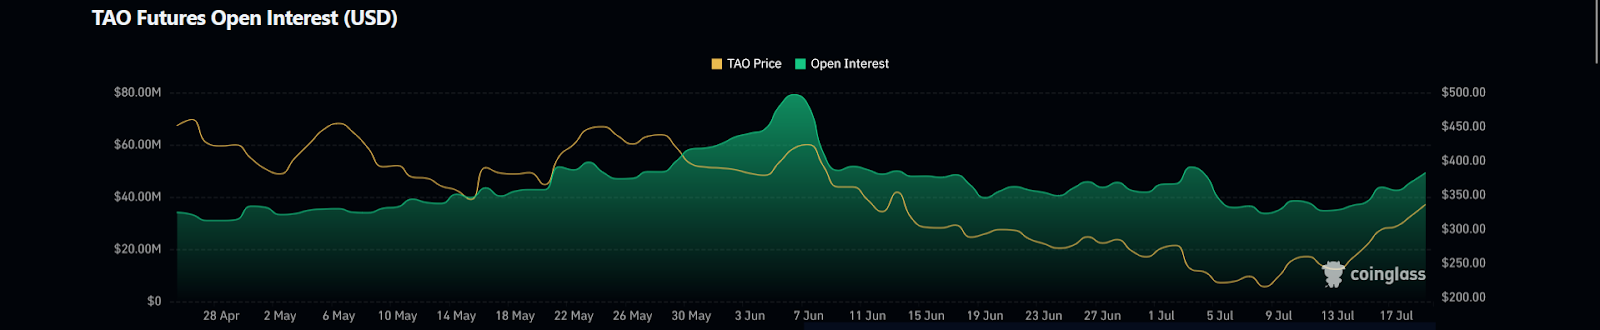
$TAO Derivatives Data
As per $TAO derivatives data analysis, 3.43% more contracts were opened ($47.70 Million) OIs in total.
 $TAO">
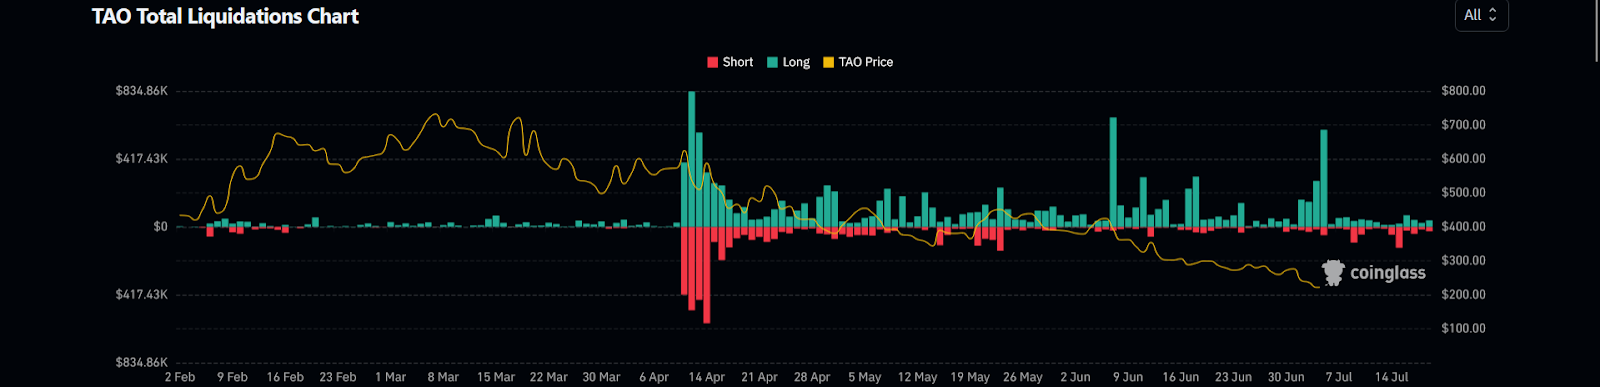
Its derivative volume has also surged, amounting to a total of $98.80 Million. Liquidation data was also good. It favoured mostly bulls, as more shorts were liquidated than longs. Intraday, the interruption in price witnessed at the 200-day EMA, which could be a sign of profit booking.
 $TAO">
Meanwhile, the shorts in 24 hours amounted to less than longs at $42.5K, whereas the long liquidation amount was higher at $61.06K.
Bittensor ($TAO) Price Structure Overview
From January 8th, 2024, to March 7th, 2024, $TAO rose over 290%, where the price accelerated massively from $193 to $755.86. However, the price encountered a supply zone and failed to harness further gains on the daily chart.
After failing to surpass $756, the price entered a streak of lower lows, going back to the initial demand zone in the next 4 months by July 5th. However, the price once again surged with the broader market bullish sentiment and rose over 65% in the past two weeks, and nearly 38% growth in the past 1 week.
As of writing, the price managed to break the upper border of the channel. It seems like a bullish pattern, precisely the falling wedge’s breakout. Therefore, if the breakout continues, then the upper targets lie around $370, and $430, respectively.
On the contrary, if the price declines and trades back into the pattern, then this pattern would lose its significance, and a bearish perspective or sideways perspective could prevail. But, if the price slips to $260, then the first support would be the demand zone at $200, and the second support would be at $135.
Indicators are bullish: MACD showed a bullish cross with a growing histogram at 13.75, and RSI jumped from 14-SMA towards overbought, which flashed at 63.12.
$TAO has surged over 65% in the past two weeks but faced resistance at the 200-day EMA. Despite weak liquidity, $TAO remains in the top 50 crypto list by market cap. Investors should be cautious due to the volatile market.
The price action suggests a bullish breakout, with potential targets of $370 and $430. However, a break below the pattern could lead to a decline towards $200 or even $135.