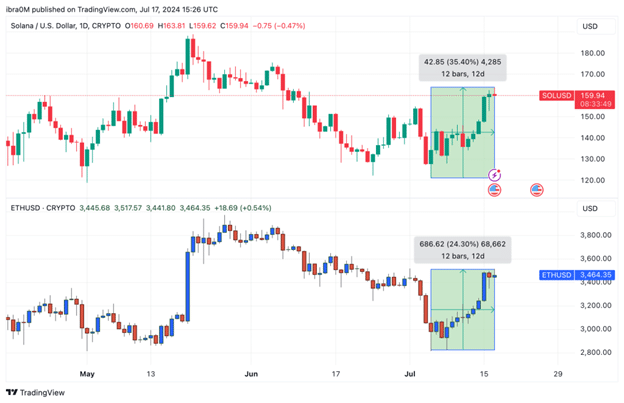
Solana price reached $163 on Wednesday, July 17, its highest in 40 days of trading, recent capital inflows into the SOL derivatives markets suggests more upside could follow.
Solana Price Outperforms Market Average with 35% Rally
Solana has recently experienced notable price action driven by a combination of internal developments and external market factors. Over the past few weeks, Solana’s price has climbed significantly, reflecting growing investor confidence and the network’s ongoing advancements.
The first leg of the Solana market rally began in late June after news broke that two investment first, 3iQ capital in Canada and VanEck in the USA applied for spot SOL ETFs within their jurisdictions.
While the rally was initially subdued, Solana bulls eventually gained a foothold over the weekend after the US authorities published dovish Non-Farm Payrolls and Consumer Price Index (CPI) data.

Looking at the chart above, we see how solana price of solana has increased from $121 on Friday July 5, to reach a daily timeframe peak of $163.81 at the time of writing on July 17. This reflects a 35.40% rebound in Solana prices over the last 12 days of trading.
While the rest of the crypto markets have been on an uptrend this week, thanks to dovish macroeconomic speculations, Solana appears to be a standout performer. For context, Ethereum price has witnessed only a 25% upswing in the last 12 days despite enjoying a much broader media coverage since it was announced that the ETH spot ETFs would now launch on July 23.
With Solana outperforming Ethereum by nearly 10% over the past two weeks, it suggests the presence of vital internal bullish catalysts driving SOL prices.
Solana Open Interest Crossed $2 Billion as Bulls Traders Seize Control.
One of the primary internal catalysts for Solana’s recent price surge is the speculation that Ethereum ETFs listing could significantly increase the likelihood that Solana ETFs will follow suit in the long-run. Market data trends show that many strategic traders have moved to front-run gains from this positive narrative.
In an indication of this, Coinglass’ Open Interest chart below tracks the real-time changes in the value of capital activity invested into Solana’s derivatives futures contracts.

Looking at the chart above, Solana open interest has now reached $2.2 billion at the time of publication on July 17. Notably this is the first time the Solana open interest has crossed the $2.2 billion threshold in 40-days dating back to June 7.
A closer look at the data shows that Solana’s 35% price uptick over the last 12 days has far outpaced the growth in Open Interest, which has only increased by 22% during that period.
When an asset’s open interest grows faster than its price, strategic investors may interpret it as a critical bullish signal for two main reasons. Firstly, it indicates increased participation and confidence in the asset’s future price movements, suggesting that more investors are opening new positions. This heightened activity often reflects positive sentiment and expectations of further price increases.
Secondly, higher open interest relative to price growth can signal that traders are willing to hold their positions longer, anticipating continued bullish momentum. This commitment to maintaining positions underlines a strong belief in the asset’s potential and will likely contribute to a sustained Solana price uptrend as buying pressure persists ahead of the Ethereum ETF launch scheduled for July 23.
Solana Price Forecast: $180 is the Next Target
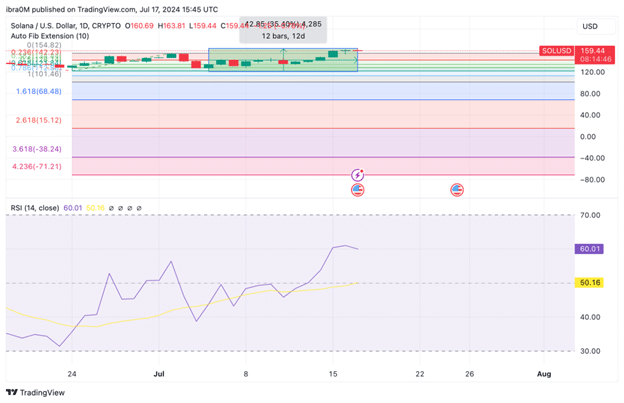
Looking at the chart above, Solana (SOL) is demonstrating a robust bullish momentum, with the price currently sitting at $159.44. The recent 35% price increase over the past 12 days, accompanied by an increase in open interest, indicates a strong buying interest and growing confidence among investors. Notably, the RSI (Relative Strength Index) is hovering around 60.01, signaling that while the asset is nearing overbought territory, there is still room for further upward movement before reaching critical levels.
One key resistance level to watch is at $154.82, which corresponds to the 0.236 Fibonacci retracement level. This level has been tested recently and broken, suggesting that Solana has the potential to continue its upward trajectory.
If the bullish momentum persists, the next significant resistance to watch will be at the psychological level of $180. This level not only represents a round number resistance but is also likely to be a critical point where profit-taking could occur.

On the downside, the primary support level is located around $101.46, which aligns with the 0.786 Fibonacci retracement level. This level has provided strong support in the past and is likely to act as a safety net in case of a pullback.
In summary, Solana’s recent market dynamics suggests a bullish outlook with the next target set at $180, and an immediate support buy-wall at $140. With the current technical indicators pointing towards continued upward movement and robust investor confidence reflected in the rising open interest, Solana is well-positioned for further gains.
 thecryptobasic.com