Shiba Inu (SHIB) could leverage a rare convergence of market patterns to engineer a 129% recovery back to its yearly peak.
The market is currently on a recovery path, with Bitcoin (BTC) on the verge of reclaiming the $65,000 territory. Shiba Inu has capitalized on this market-wide rebound to recoup lost grounds. With a 19.68% gain in seven days, SHIB is the second biggest weekly gainer among the 15 largest cryptocurrencies.
Shiba Inu Faces Reduced Interest Despite Uptrend
However, its recovery campaign has not received sufficient boost from market participants. This is due to an observable decrease in market activity despite the ongoing rebound. The Crypto Basic recently discovered that SHIB buying interest has been relatively low compared to previous uptrends.
This trend is possibly due to investor apathy as most market participants are uncertain if bulls can sustain the ongoing rebound. Notably, Shiba Inu’s 24-hour trading volume has been poor, especially for a period of upsurge. Marker data shows volume has averaged a meager $262 million over the past week.
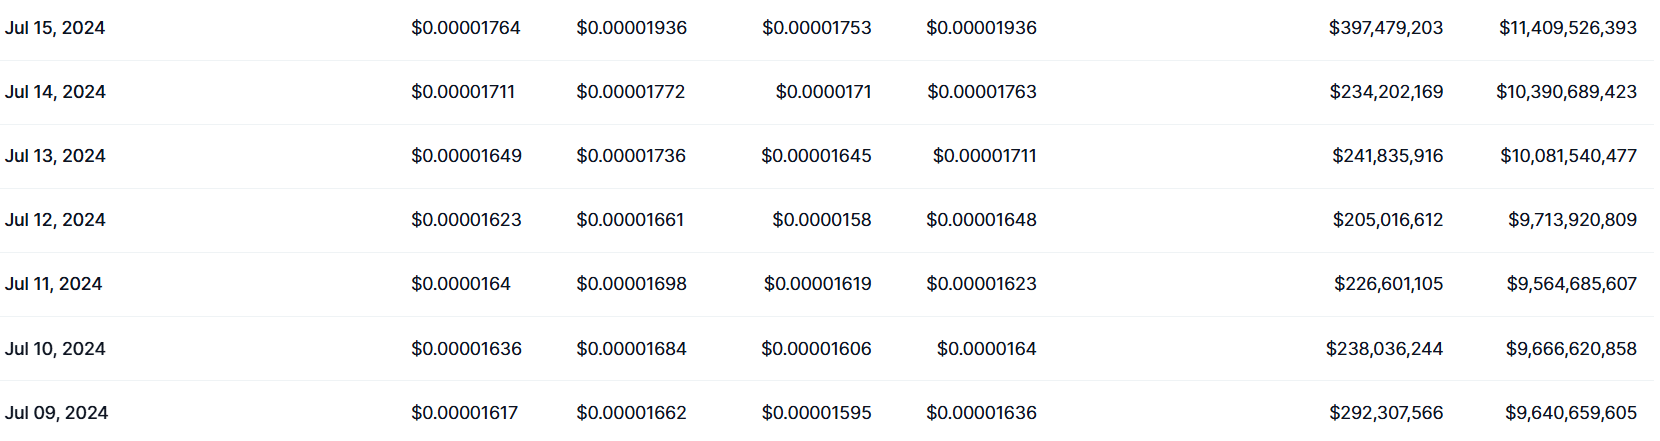
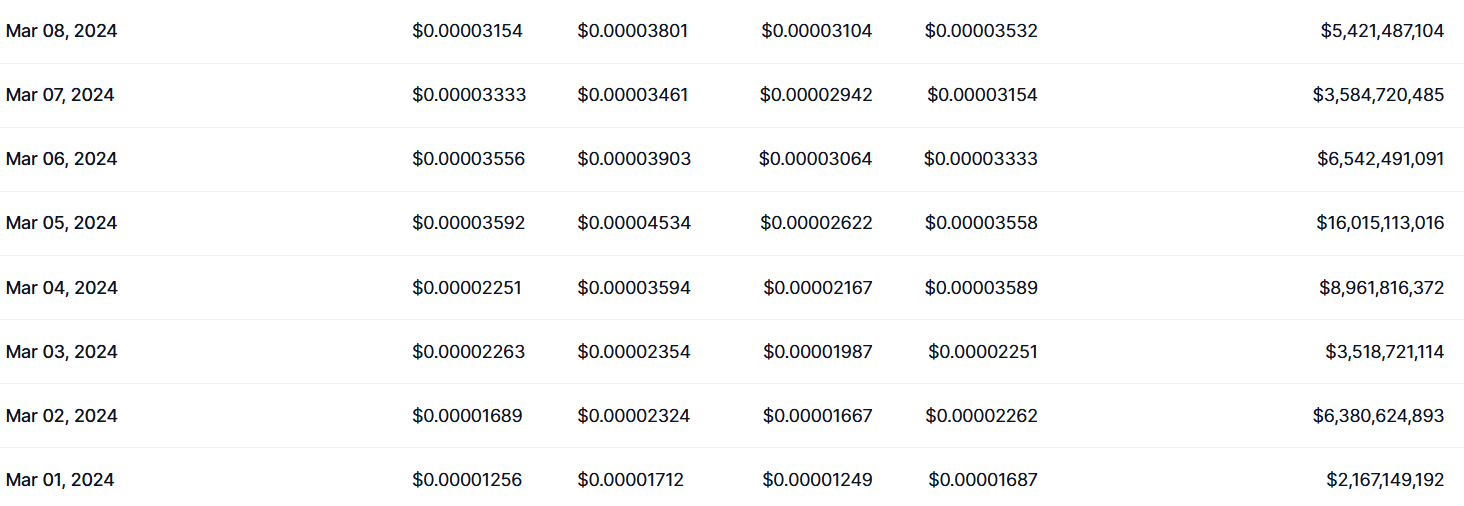
While this is comparatively higher than SHIB’s trading volume during a consolidation phase, it is below expectations for an uptrend. For context, during the previous uptrend that saw Shiba Inu hit a new yearly peak of $0.000045, SHIB’s volume averaged a massive $7 billion from March 1 to 8.
Notably, for Shiba Inu to receive a significant boost to the ongoing rally, its volume must increase significantly. This sort of increase can come from a renewal of investor interest, contributing to heightened trading activity.
SHIB Requires Increased Volatility and Heightened Trading Activity
To put this into perspective, Shiba Inu requires a convergence of increased trading activity and rising volatility to record a price pump similar to the one in early March.
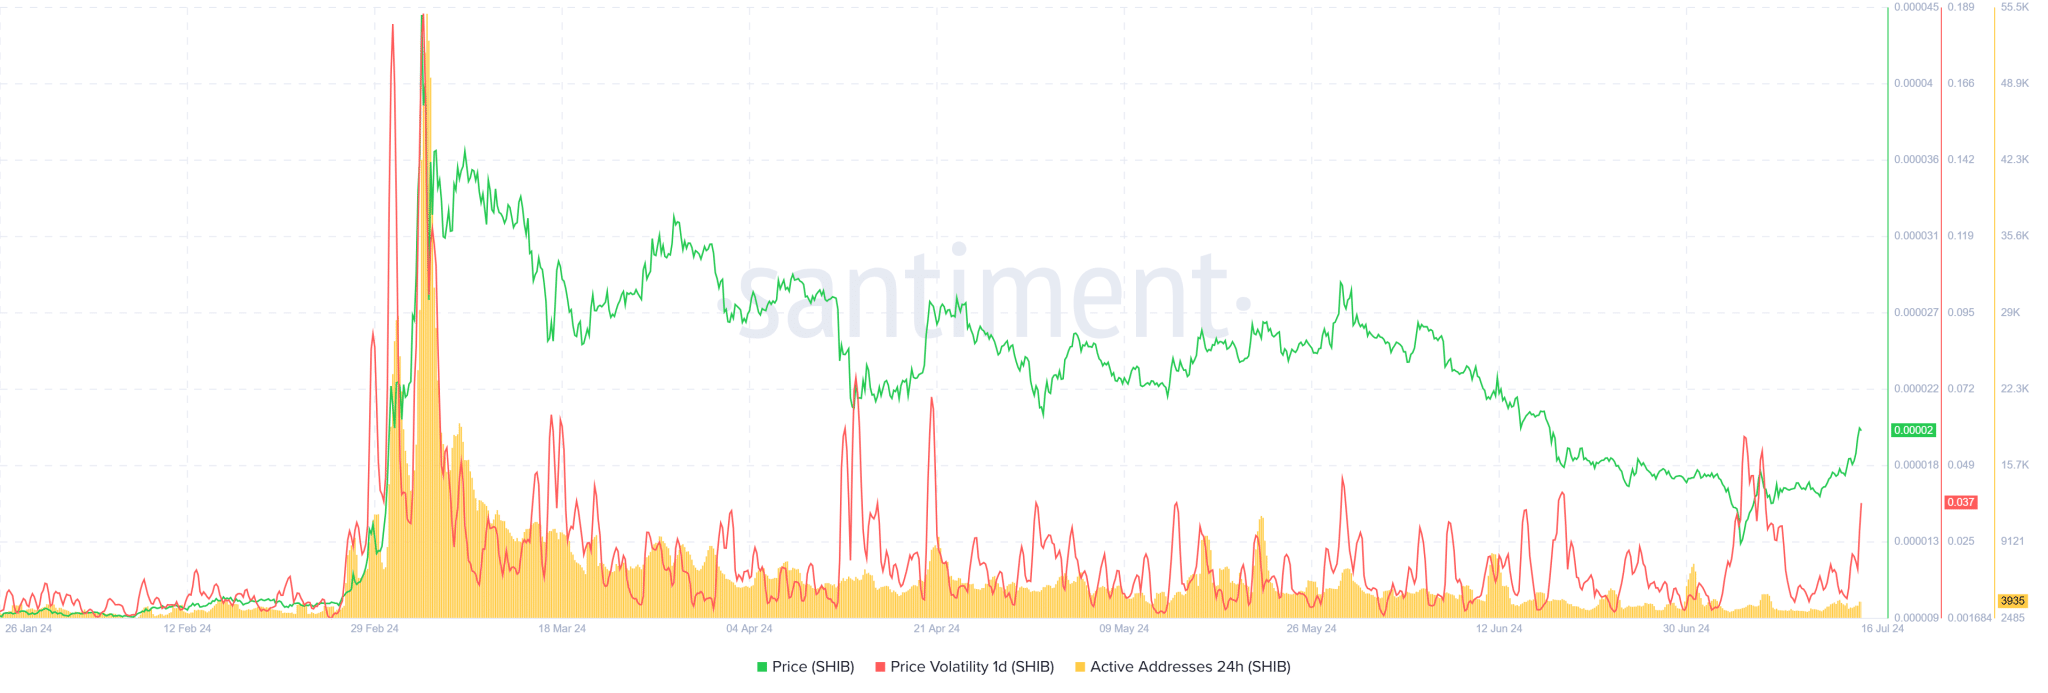
Interestingly, during this March uptrend, SHIB observed an increase in daily active addresses and daily volatility. For context, daily active addresses surged to 42,334 on March 5, while volatility hit 0.1794 on that day. The convergence of these two metrics resulted in the spike that eventually led to $0.000045.
However, data from Santiment confirms that the ongoing rebound has only triggered a rise in volatility. Notably, Shiba Inu recently saw a spike in volatility to a 3-month high of 0.0574. However, this spike did not occur alongside an increase in active addresses, which currently amount to a meager 3,974.
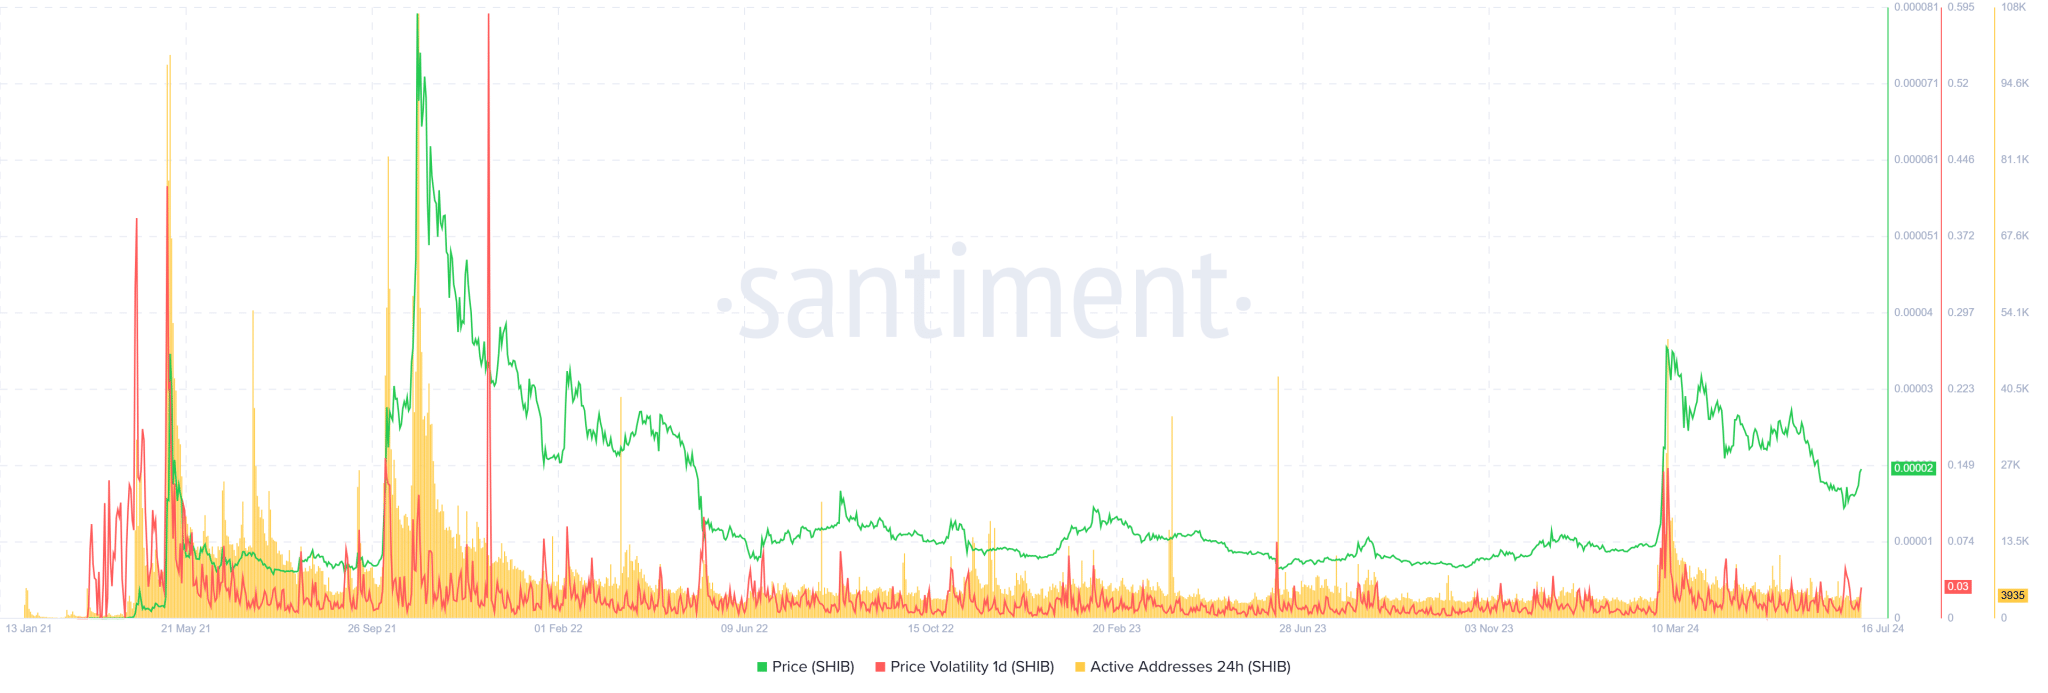
Historically, each time Shiba Inu saw a robust spike, it typically occurs when volatility and active addresses rise together. The market observed this pattern in May 2021, when SHIB spiked to $0.00003. It also occurred in October 2021 during the surge to the ATH of $0.00008845.
Shiba Inu Resistance Levels
Should SHIB record a similar convergence during this rebound, the uptrend could lead to greater heights. Shiba Inu currently trades at the $0.000019 level, looking to recover and sit above $0.00002. According to IntoTheBlock data, SHIB could face resistance between $0.00002 and $0.000025. This range features a sell wall with 97,160 addresses.
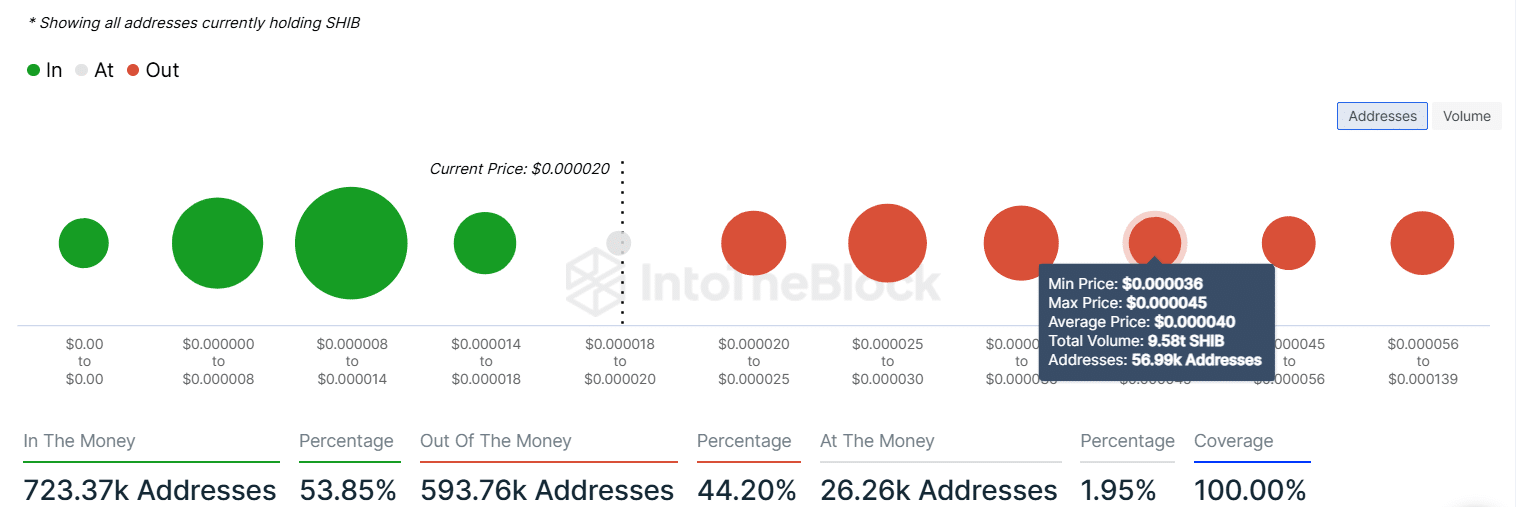
However, the more robust sell walls lie in the $0.000025 to $0.00003 range and the $0.00003 to $0.000036 range. These two walls represent Shiba Inu’s biggest resistance points. Accordingly, a breach could bring SHIB face-to-face with the weaker resistance at $0.000045, where 56,990 addresses hold 9.58 trillion tokens. A rise to $0.000045 would necessitate a 129% increase.