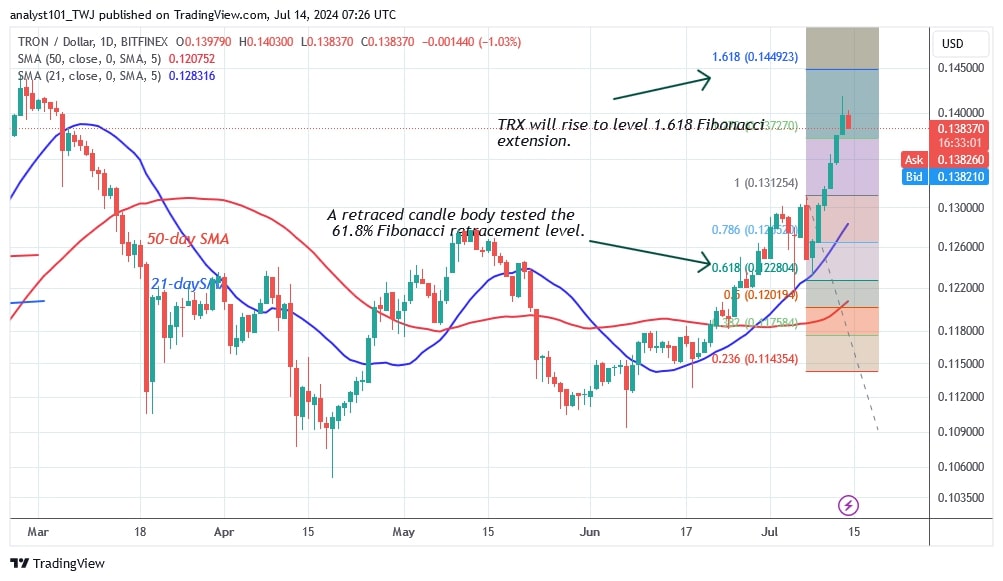
The price of TRON (TRX) has continued to rise after breaking above the $0.127 resistance. The positive trend has continued and has reached its all-time high of $0.1418.
Long-term forecast for the TRON price: bullish
On July 7, the bearish candlestick body approached the 61.8% Fibonacci retracement level. The retracement or correction predicts that the altcoin will rise to the Fibonacci extension of $1.618 or to a high of $0.1449.
On the upside, the current rally is encountering early resistance at the high of $0.14.
On February 26, buyers were rejected at $0.144 and TRON fell to $0.10. According to the price indication, the altcoin will reach its previous high of $0.1449.
Now, the uptrend is hitting an early resistance at $0.14. TRON is currently worth $0.138.
TRON indicator reading
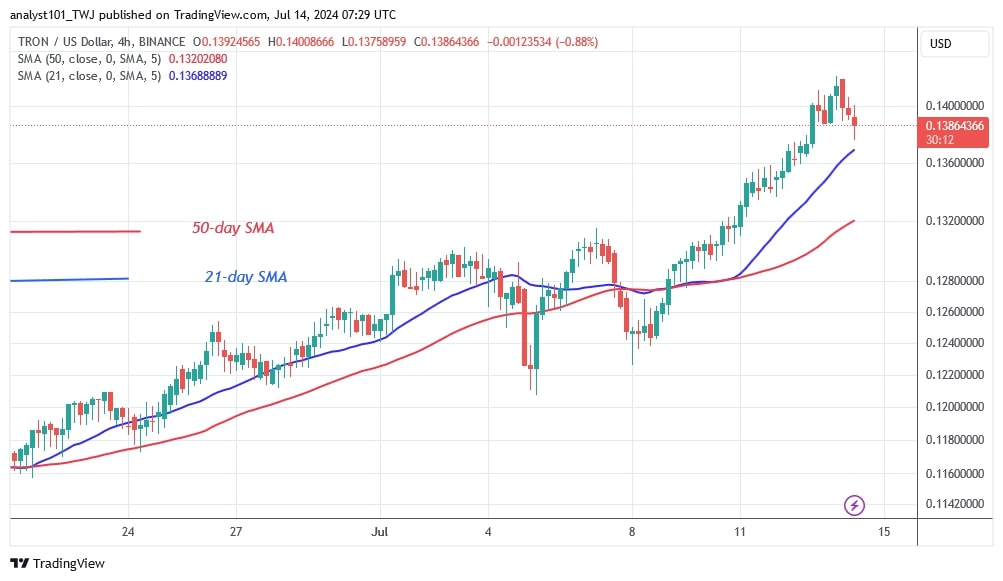
TRON is in an uptrend with the price bars above the upward moving average lines. On the 4-hour chart, the price bars have moved back above the 21-day SMA. The rise could stop if the price of the cryptocurrency falls below the 21-day SMA. The bearish momentum will continue until the low of the 50-day SMA. The selling pressure will increase again once the price falls below the moving average lines.
Technical Indicators
Key supply zones: $0.13, $0.14, $0.15
Key demand zones: $0.10, $0.09, $0.08

What is the next move for TRON?
TRON has risen to its historical price of February 26. The current rally has paused around the $0.14 barrier. The price of the cryptocurrency broke out above the $0.14 resistance level before pulling back. The altcoin is trading below the resistance level but above the 21-day SMA support. Once the resistance level is broken, the altcoin will continue its uptrend; otherwise, it will break down or be forced into a range below the recent high.

Disclaimer. This analysis and forecast are the personal opinions of the author. They are not a recommendation to buy or sell cryptocurrency and should not be viewed as an endorsement by CoinIdol.com. Readers should do their research before investing in funds.
 coinidol.com