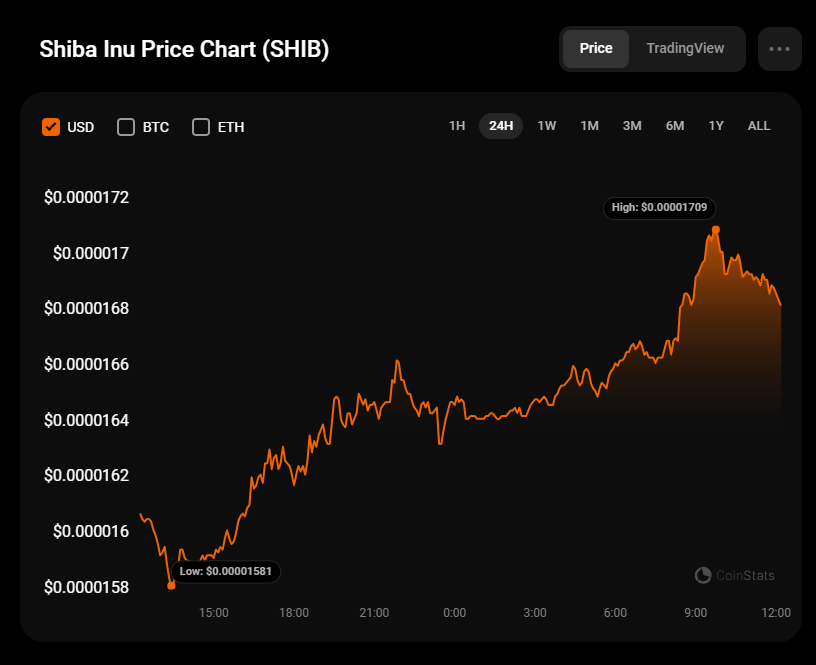
Buyers are back in the game, according to CoinStats.
$SHIB/USD
The price of $SHIB has risen by 4.57% over the last day.
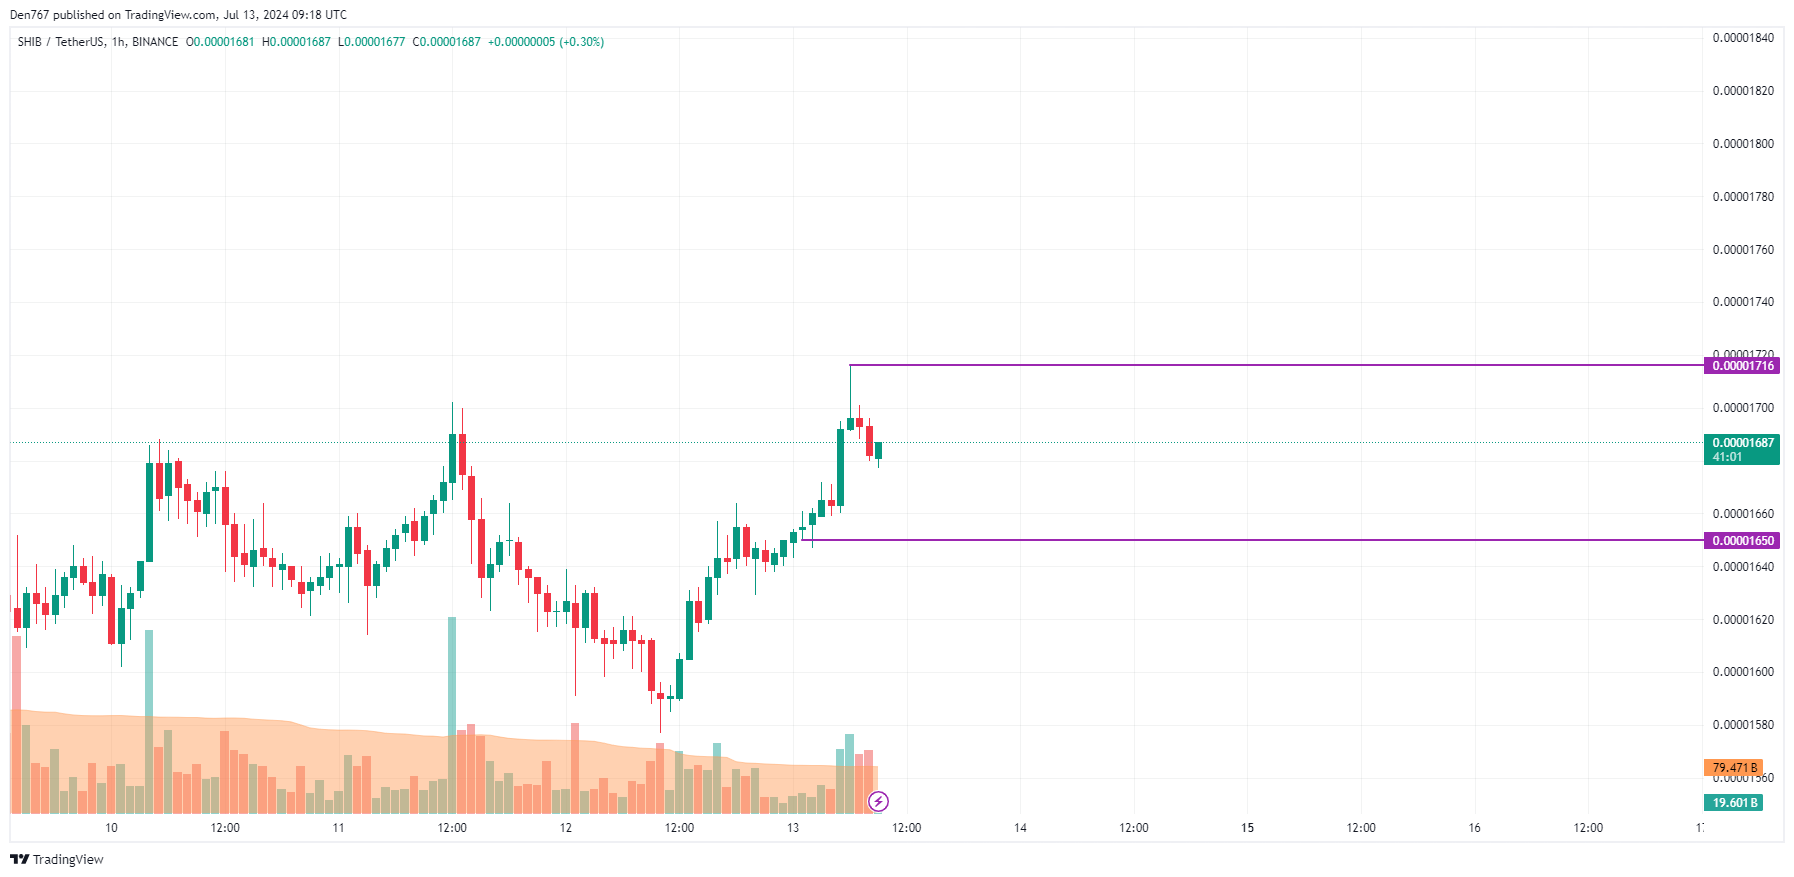
On the hourly chart, the rate of $SHIB is in the middle of the local channel. However, if the daily bar closes near the resistance, there is a chance of a breakout, followed by a move to the $0.00001760 zone.
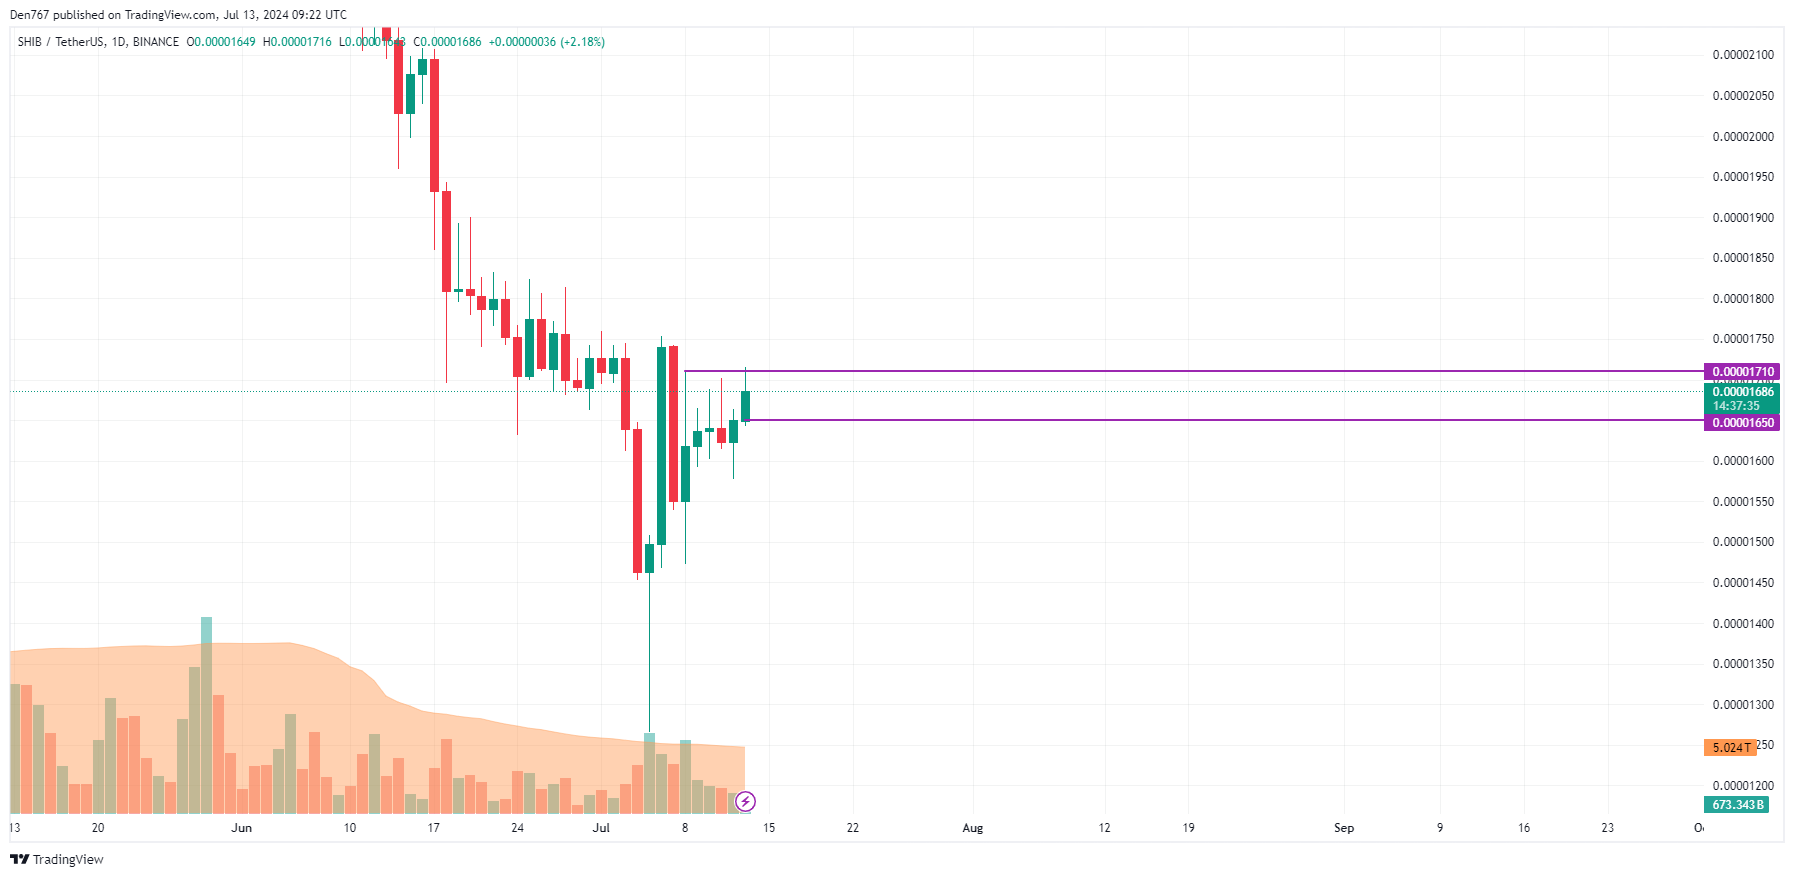
On the bigger time frame, one should pay attention to the candle closure in terms of the level of $0.00001710.
If it happens near it and with no long wick, the accumulated strength might be enough for a rise to the $0.000018 range.
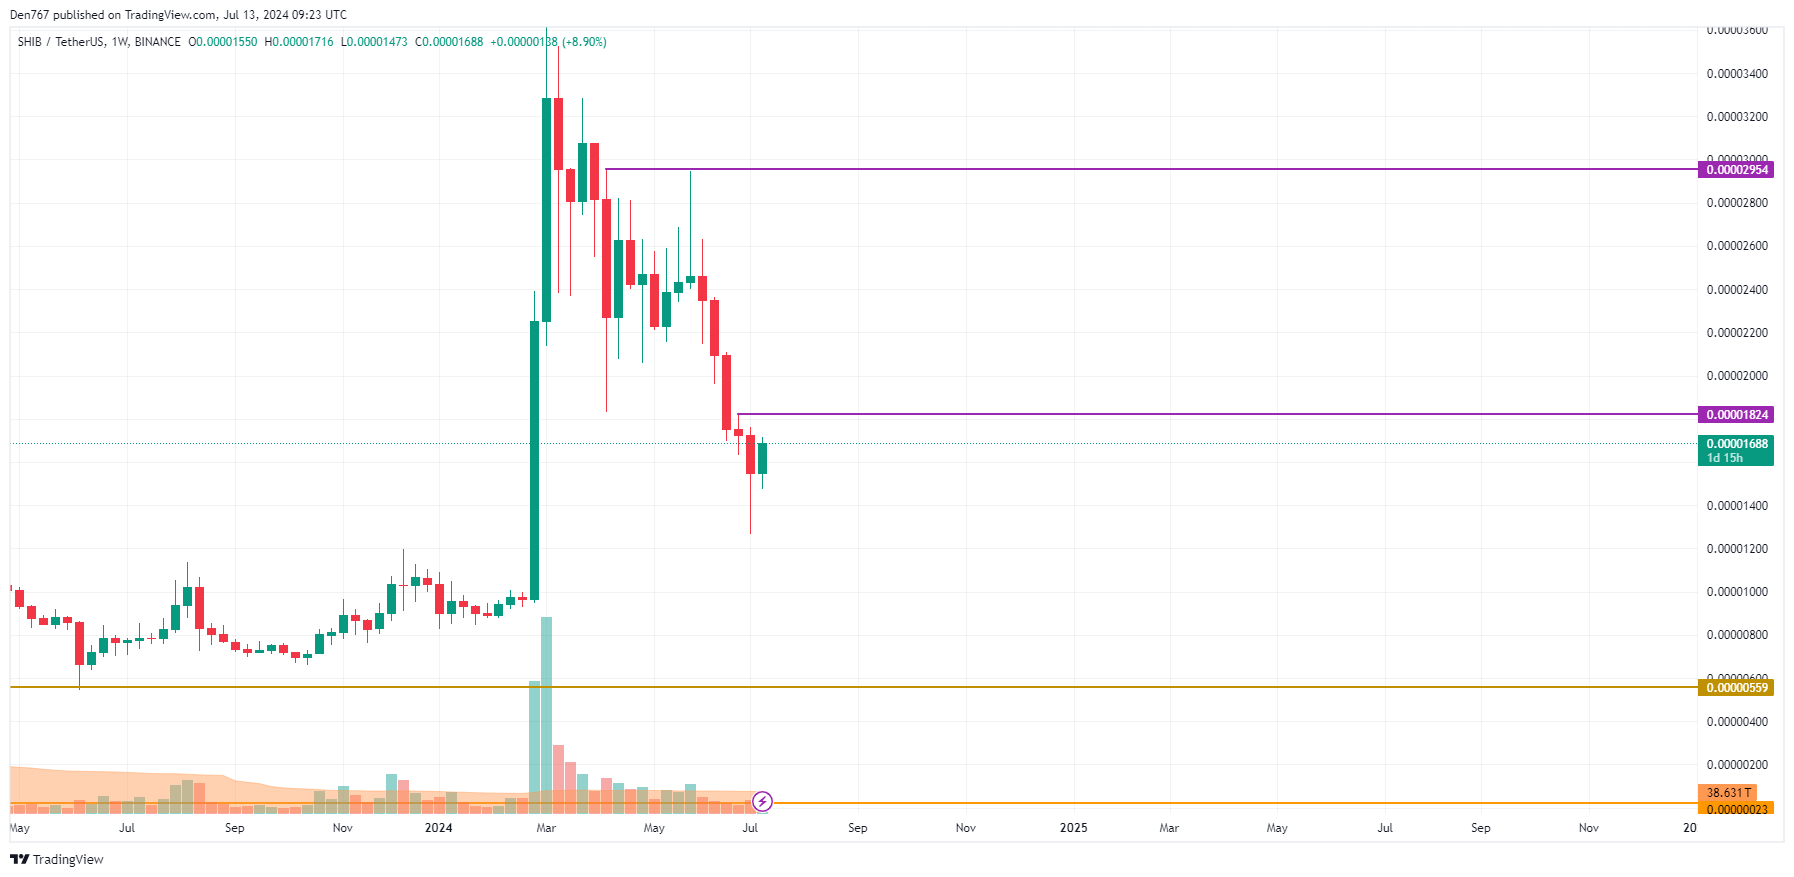
On the weekly chart, a fast reversal is unlikely, even though the bar might close in the bullish zone. Meanwhile, sideways trading in the area of $0.000016-$0.000018 is the more likely scenario.
$SHIB is trading at $0.00001689 at press time.