
Altcoin dominance has fallen by 2% over the past week. This indicates that crypto assets other than Bitcoin (BTC) have underperformed compared to the leading cryptocurrency.
Meanwhile, Bitcoin’s dominance has seen a modest increase of 1% during the same period. This suggests that the coin has witnessed more trading activity than altcoins in the seven-day period under review.
Brett ($BRETT) Leads as the Altcoin With the Most Losses
Referred to as Pepe’s (PEPE) best friend on Base Chain, Brett ($BRETT) is the altcoin with the most losses in the past seven days. Exchanging hands at $0.12 at press time, the altcoin’s value has plunged by 23% in the last week.
Impacted by the general decline in activity in the altcoin market, $BRETT’s demand by market participants has dwindled in the past few weeks. Measured by its Relative Strength Index (RSI), the on-chain metric shows that $BRETT’s selling pressure currently exceeds all buying activity. As of this writing, the metric’s value is below the 50-neutral line at 49.52.
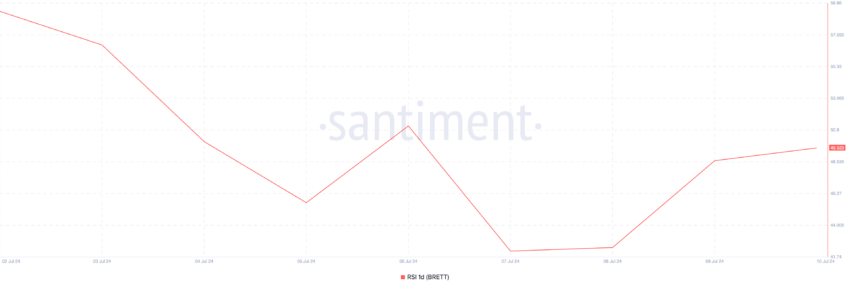
An asset’s RSI measures its overbought and oversold market conditions. It ranges between 0 and 100. Values above 70 suggest that the asset is overbought and due for a decline, while values below 30 signal that the asset is oversold and may witness a reversal.
Confirming the bearish bias toward the altcoin, its Elder-Ray Index has returned only negative values since July 3. As of this writing, the indicator’s value is -0.01.
If the current downtrend is maintained, $BRETT’s price may fall to $0.10.
Read More: 12 Best Altcoin Exchanges for Crypto Trading in July 2024
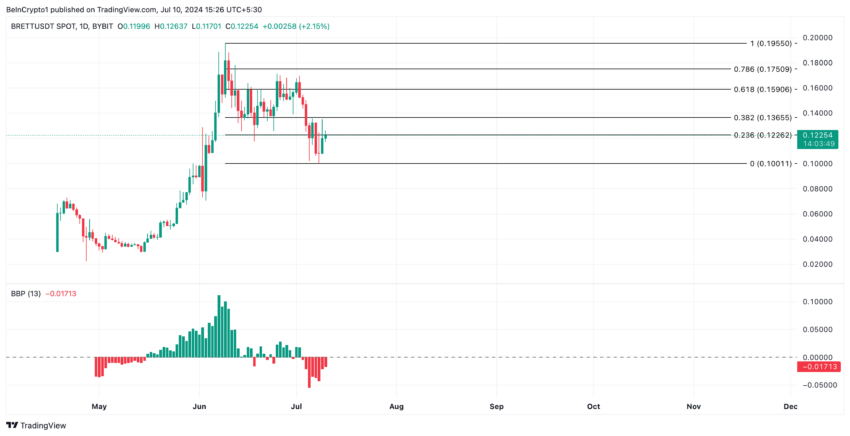
However, a spike in buying activity will invalidate the bearish projection above. It will push the altcoin’s price to $0.13.
Sui ($SUI) Charges Toward Key Moving Average
Also mirroring the general decline in the altcoin market, Sui’s ($SUI) value has dropped by 10% in the past seven days.
However, readings from its price movements on a one-day chart suggest a spike in buying activity. For example, $SUI’s price trends toward its 20-day exponential moving average (EMA) appear poised to cross above it.
An asset’s 20-day EMA measures its average price over the past 20 days. When an asset’s price attempts to cross above this key moving average, it is a bullish signal. It suggests buyers are gaining control, potentially pushing the price higher.
If $SUI buying activity continues to surge, its price might rally to $0.76.
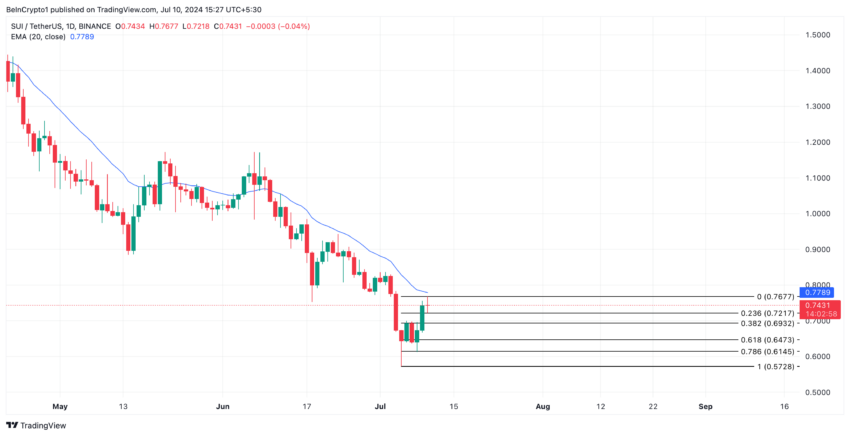
However, if profit-taking activity commences, $SUI will shed its recent gains to trade at $0.72.