
Retail investors drove $60 million loss in Chainlink ($LINK) amid a capitulation spike, signaling a potential local bottom and confidence from large holders.
Recent data from Santiment indicates that Chainlink may be approaching a market bottom. This conclusion stems from significant investor behavior, including the largest trader capitulation spike of the year, substantial realized losses, historical precedent, and the movement of dormant coins.
🔗 Chainlink's weak hands have just shown signs of giving up hope and released significant levels of coins. The 60M in $LINK realized losses yesterday is indicative of significant trader FUD, and increases the likelihood of a local bottom. 👍 pic.twitter.com/EeC4LFSoQz
— Santiment (@santimentfeed) July 9, 2024
Chainlink recently experienced its largest trader capitulation spike of 2024, with weak hands selling significant amounts of $LINK at a loss. Such capitulation often signals a market bottom, suggesting the current selling pressure might be peaking. On July 8, realized losses amounted to $60 million, the highest in 2024. This figure reflects a high level of fear, uncertainty, and doubt (FUD) among traders.
When It Last Happened
On April 13, a similar event occurred, with a large realized loss spike followed by a 17% price increase over the next ten days. This historical pattern suggests that large realized losses can precede a market recovery. The recent realized losses indicate high trader FUD, potentially marking yet another turning point.
Santiment’s chart also notes the movement of dormant $LINK tokens inactive for an extended period. The activation of these dormant coins usually signifies a change in market sentiment or anticipation of significant market movements.
Most Addresses Hold Between 0 – 100 $LINK
Holdings distribution data reveals that most Chainlink addresses hold between 0 – 100 $LINK. Notably, addresses holding between 100K – 10M $LINK are fewer but represent more stable, long-term investors. This distribution suggests that while retail investors dominate, there are also substantial holdings by larger investors.
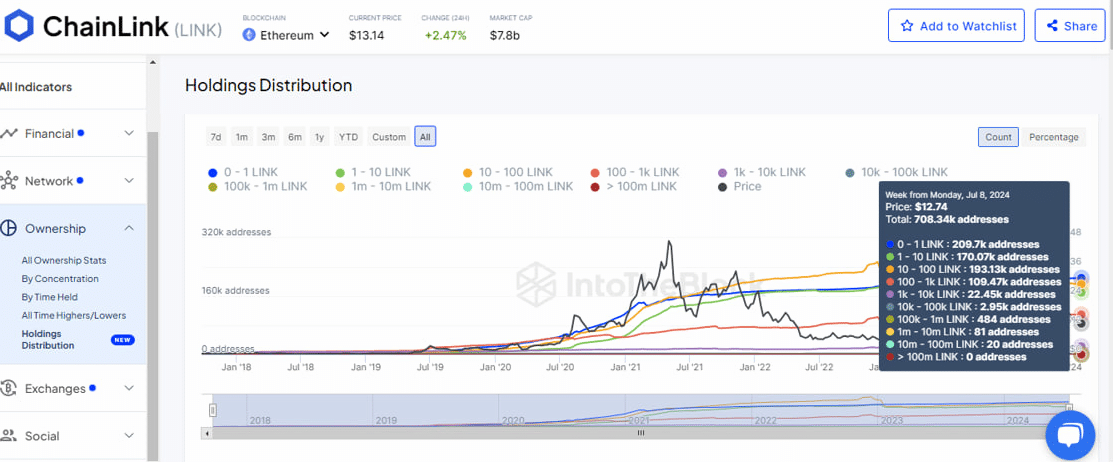
The Santiment analysis aligns with this distribution data, highlighting major trader capitulation and significant realized losses. Ultimately, smaller investors likely drove the $60 million in realized losses, while larger holders’ movement of dormant coins indicates strategic repositioning rather than panic selling.
Long-Term Bet?
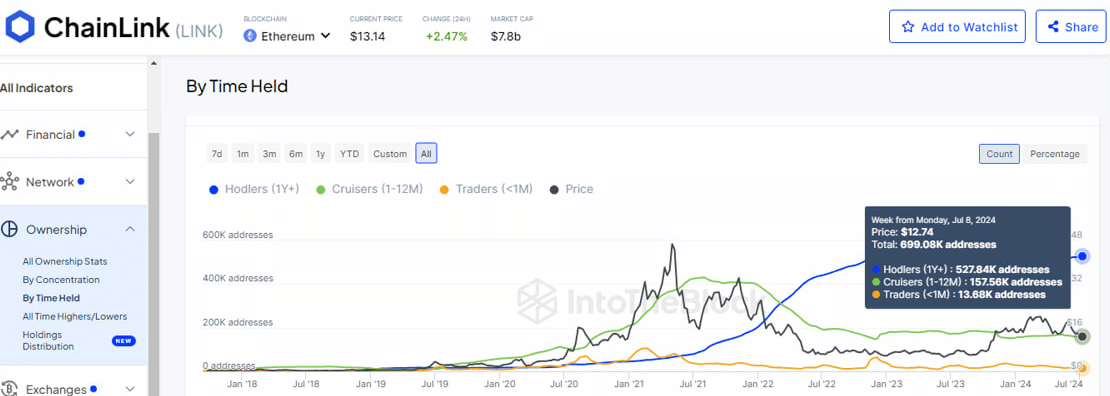
The By Time Held distribution chart further clarifies the behavior of $LINK holders. Hodlers (1+ year) make up the largest group, indicating confidence in Chainlink’s long-term potential. Cruisers (1-12 months) and short-term traders (<1 month) represent intermediate and short-term speculators, respectively.
These observations come only a day after another report that Chainlink whales were increasing their holdings, adding over 6.2 million $LINK, valued at approximately $76.88 million. This accumulation, reported by Ali Martinez, further shows the confidence of large holders in $LINK’s future performance despite fluctuating market conditions.