
Solana's CVD indicator has just shown that the buying surplus on the asset is reaching $29 million, and it will most likely move upwards from here as the market recovery continues. However, it is important to use the metric correctly.
$SOL's CVD, which tracks net buying and selling, was positive over the previous week and came in at $29 million. If this positive net buying trend persists, it may indicate elevated demand for the asset and lead to a bullish trend reversal. The Cumulative Volume Delta, or CVD, gives traders insight into the relative abundance of buyers and sellers on the market.
Positive CVD indicates a greater degree of buying pressure than selling pressure. The information supplied demonstrates that Solana's buying activity on a number of exchanges, including Binance, Coinbase and Kraken, significantly increased following the VanEck spot ETH ETF report.
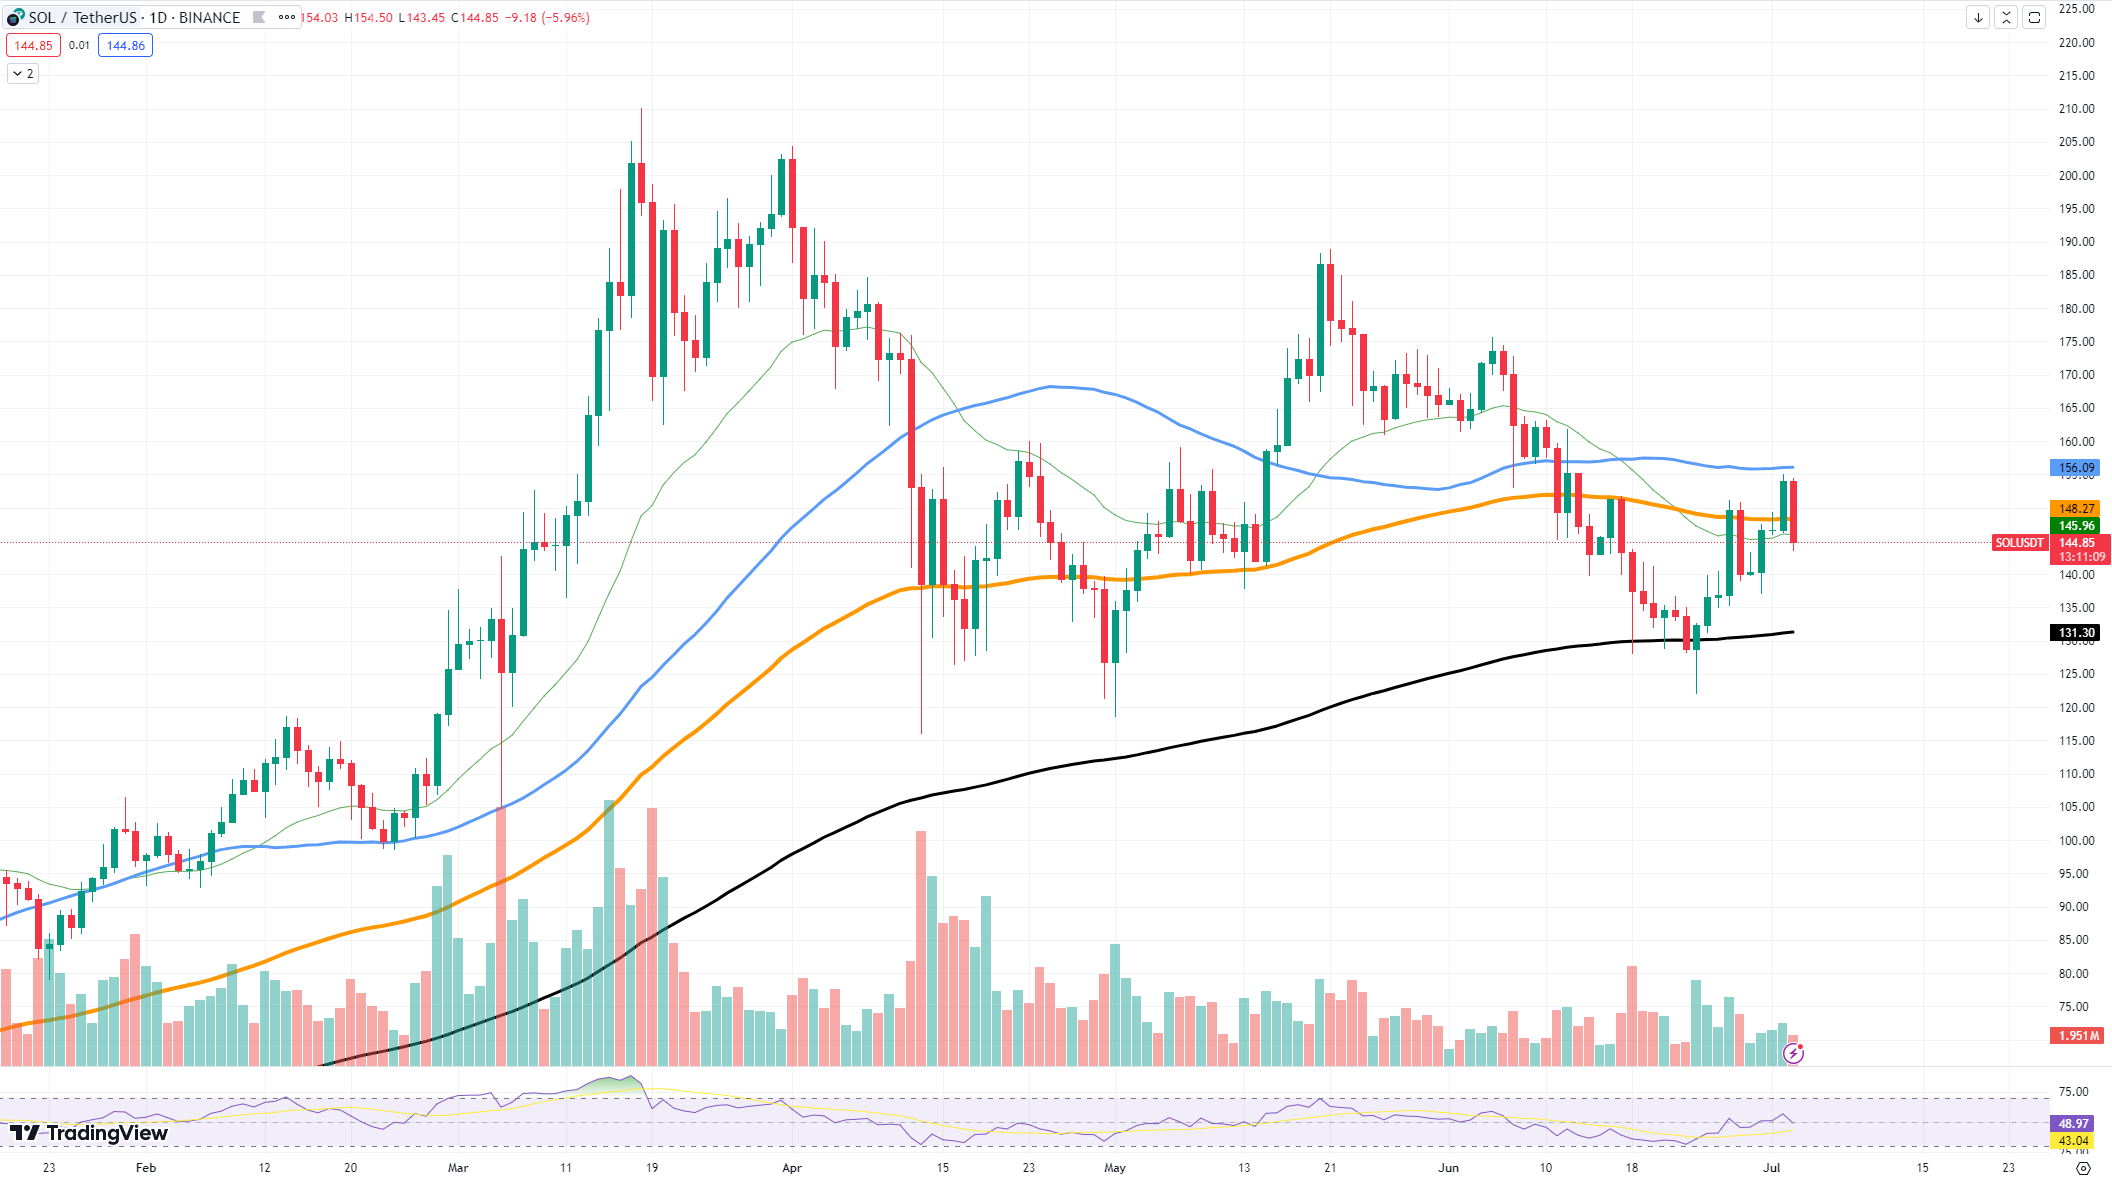
The price chart of Solana is trading at approximately $14. The asset has experienced some pullback after encountering resistance at the 50 EMA at $155. Even with these brief oscillations, the fact that it is still above the 200 EMA indicates that the overall trend may still be bullish.
In order to validate a stronger bullish trend, Solana must break above the $150 psychological threshold. Reaching this mark would indicate more momentum and might draw in more customers.
A crucial support level is found at $131, which is the 200 EMA. Solana needs to hold onto this support in order to stop additional losses and keep the current bullish sentiment going. The $29 million positive CVD is a strong indication of bullishness and may become a foundation for a bull market. It could be wise to keep an eye out for sustained positive net buying, as this is the only thing that matters for the asset right now.