Three XRP momentum oscillators, the RSI, MACD and SRSI, are on the verge of potential bullish crosses, with analyst JD projecting a potential rise in the XRP/BTC ratio to 0.00012.
JD called attention to these oscillators in a recent analysis, coinciding with the current market uncertainties. He leveraged the XRP/BTC chart on a 2-week timeframe, showcasing how Bitcoin has continued to outperform XRP since July 2023.
BTC Outperforms XRP
For context, amid its meteoric surge last July, XRP outpaced the rest of the market, including Bitcoin. This resulted in the XRP/BTC ratio spiking 59% in a week to 0.00002472. However, as XRP faced a correction, the ratio continued to decline. Market data shows that XRP has dropped 68% against BTC over the last 52 weeks.
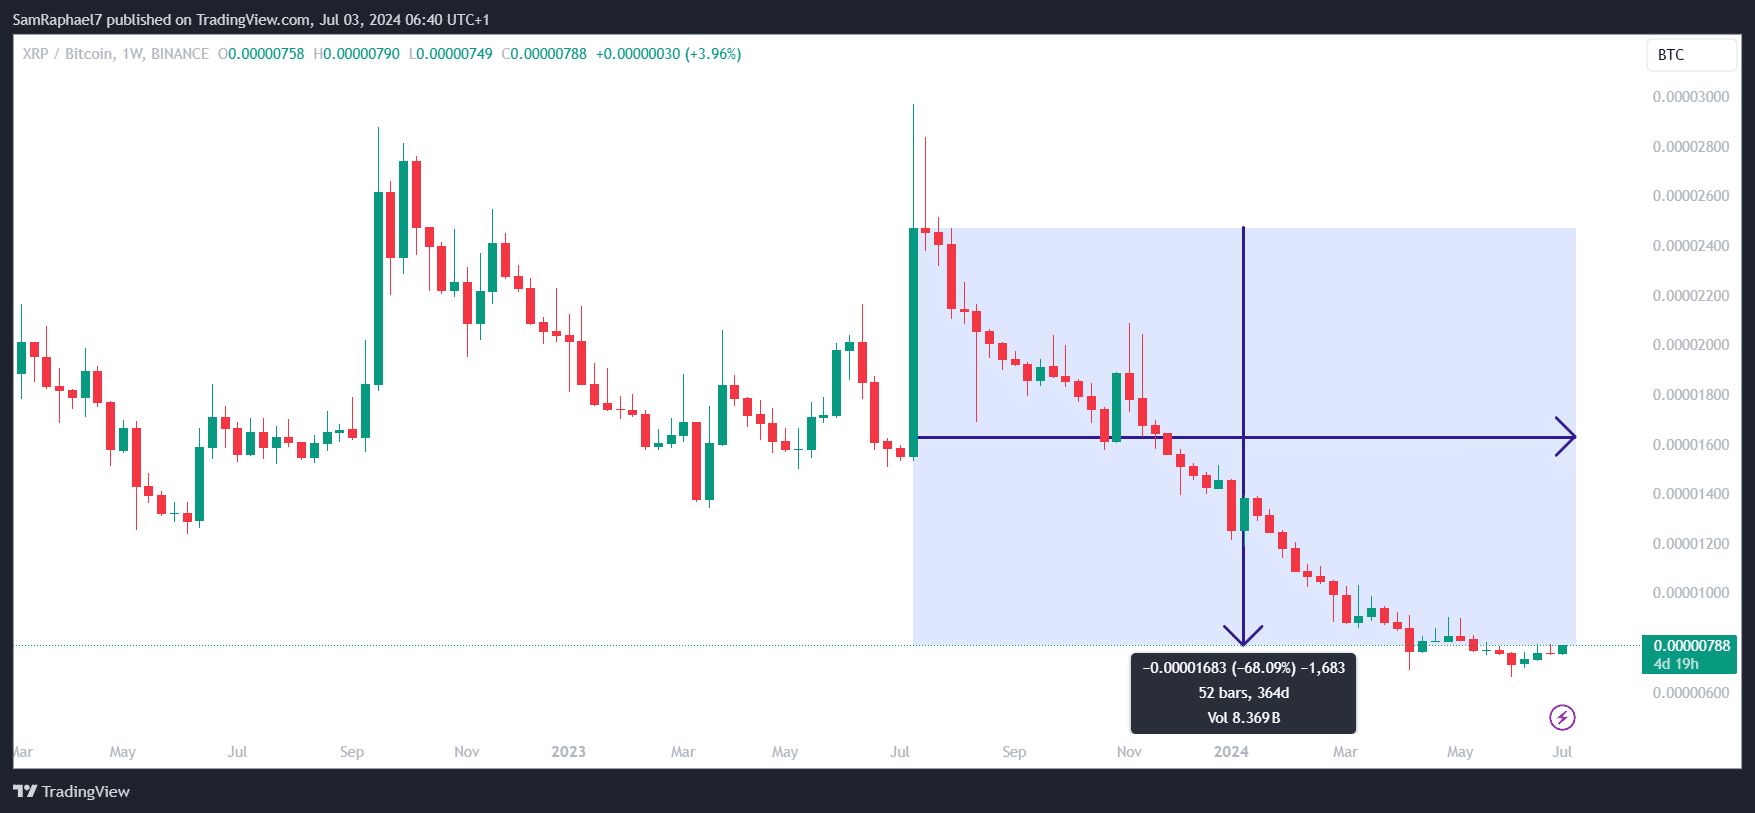
The XRP/BTC chart now trades at a low of 0.00000788, its lowest level since March 2021. However, as the bearish trend mounts, JD has identified three momentum oscillators that could lead to a looming reversal. Data from his chart points to the Relative Strength Index (RSI), Moving Average Convergence Divergence (MACD), and the Stochastic RSI (SRSI).
Momentum Oscillators Near Bullish Crosses
Notably, the XRP/BTC 2-week RSI (blue line) has dropped to 31.59. This value in itself indicates that the ratio is hovering around undervalued territory. However, more significantly, the RSI-based MA (yellow line) now sits at 31.88, with the RSI nearly crossing above it. Should this occur, it would lead to a bullish cross, suggesting an imminent rally.
In addition, the Stochastic RSI K line (blue) has recently spiked to 12.31. With the Stoch RSI D line (orange) now at 5.33, the metric has already observed a bullish cross. This development further bolsters chances of the imminent recovery indicated by the RSI.
Lastly, the MACD indicator cements this observation. Notably, the MACD line (blue) currently hovers around -0.00000276, while the Signal line (orange) rests on -0.00000259. At this level, the MACD line has recorded a bullish cross over the Signal line, solidifying the observation.
An XRP/BTC Surge to 0.00012
However, it is important to note that these three indicators need to decisively complete their bullish crosses for confirmation. Once this occurs, JD predicts an imminent spoke in the XRP/BTC pair to 0.00007. Afterward, he predicts a correction, and then a second rally toward 0.00012.
With Bitcoin currently changing hands at $61,098, an XRP/BTC value of 0.00012 would result in an XRP price of $7.33. However, there is the likelihood of BTC reaching greater heights by this time, leading to higher prices for XRP. Notably, a $7.33 price would require a 1,424% increase in XRP’s current value of $0.4807.
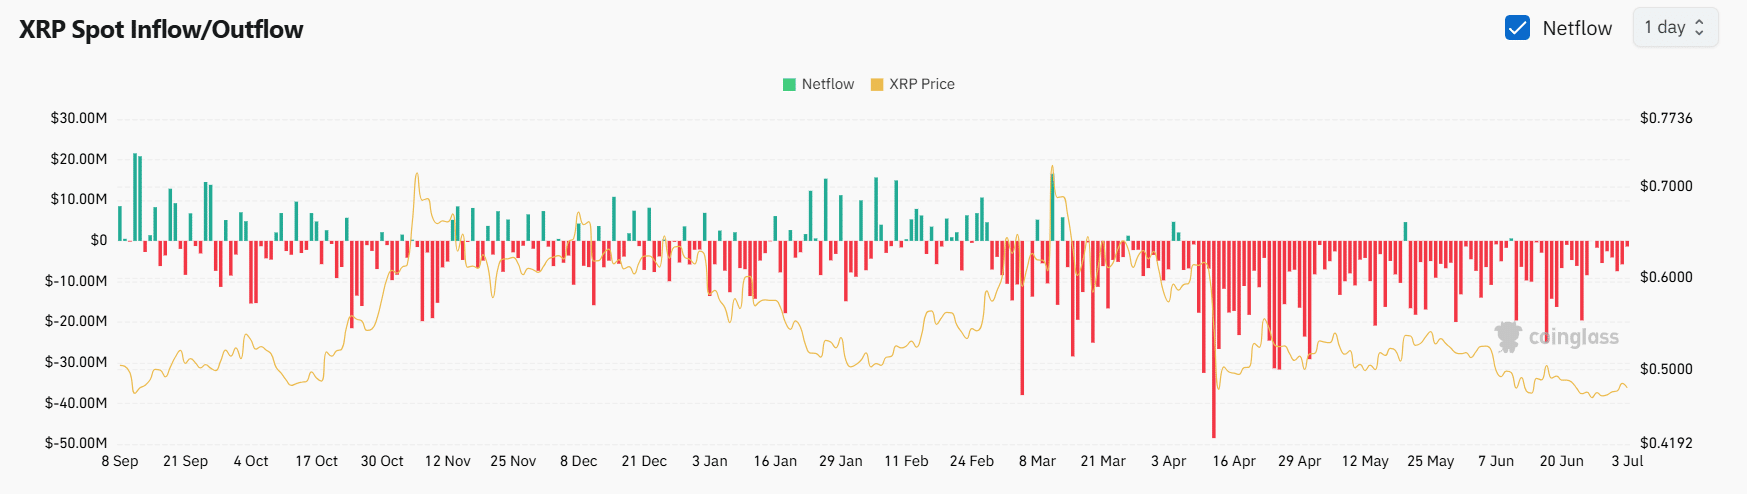
Meanwhile, XRP has continued to record negative exchange netflows for the past three months, Coinglass data shows. Over the last 87 days, exchanges have witnessed 85 days of constant net outflows. This is due to increased XRP withdrawals from these platforms, as investors look to hold onto their assets. The trend helps in reducing selling pressure.