Alikze, a TradingView view analyst who accurately predicted the current Shiba Inu collapse, now projects an imminent upsurge to the $0.000059 price territory.
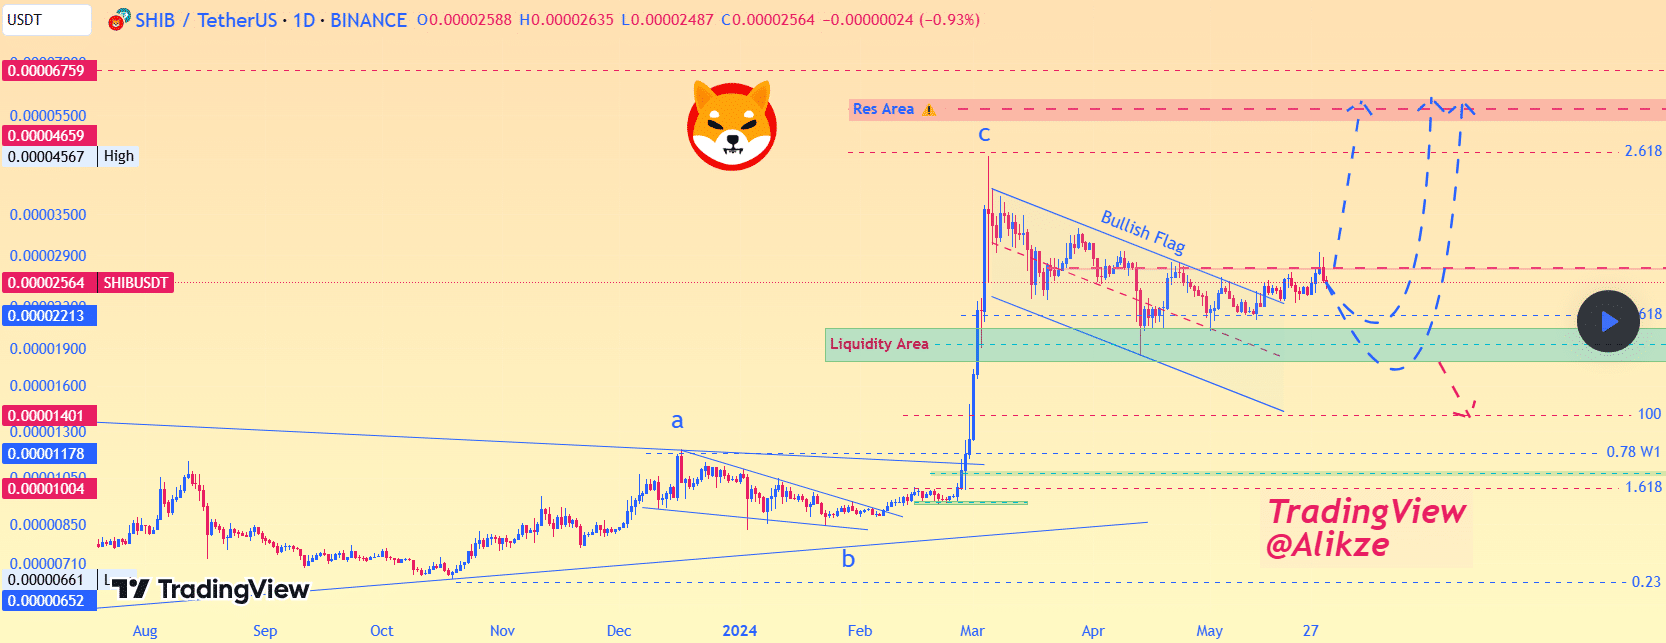
The market watcher first presented his analysis on May 31, when the downtrend was still in its infancy. At the time, Shiba Inu traded between a low of $0.00002487 and a peak of $0.00002635. During this period, SHIB held strong above the $0.00002 territory, still making attempts at retesting $0.00003.
While most commentaries then predicted a surge toward $0.00003, Alikze warned that SHIB would record steeper drops. He presented an ultimate target above $0.00005 but noted that the meme coin could take one of three paths to this level.
Shiba Inu Records Steep Declines
The first path could see Shiba Inu follow the path predicted by most analysts, laughing straight to $0.00005. In the second path, SHIB would retest a region between $0.00002084 and $0.00001786 and then skyrocket to $0.00005. He calls this region the liquidity area, marking a robust support level.
However, for the third path, Alikze predicted that Shiba Inu would reach the liquidity area and then breach below it. He predicted that if the support at the liquidity area breaks, SHIB could drop to $0.00001707. Notably, this scenario eventually played out.
Having ended June with a 32.13% collapse, Shiba Inu has broken below the liquidity area and now trades at $0.00001716. While Alikze expects an imminent recovery, he predicts steeper drops to the Fibonacci 100 area, aligning with $0.00004. He predicts this region to serve as the launchpad for greater heights.
A Potential Rally to $0.00005
When this rally eventually materializes, Alikze maintains his initial target of the $0.00005 territory. Specifically, he projects Shiba Inu to reach a price range of $0.00005387 to $0.00005937. The market commentator calls this area the resistance area.
Notably, the last time SHIB saw this price was in November 2021, during its drop from the $0.00008845 all-time high. Market analyst Davie Satoshi also projects an imminent SHIB return to the $0.00005 price territory.
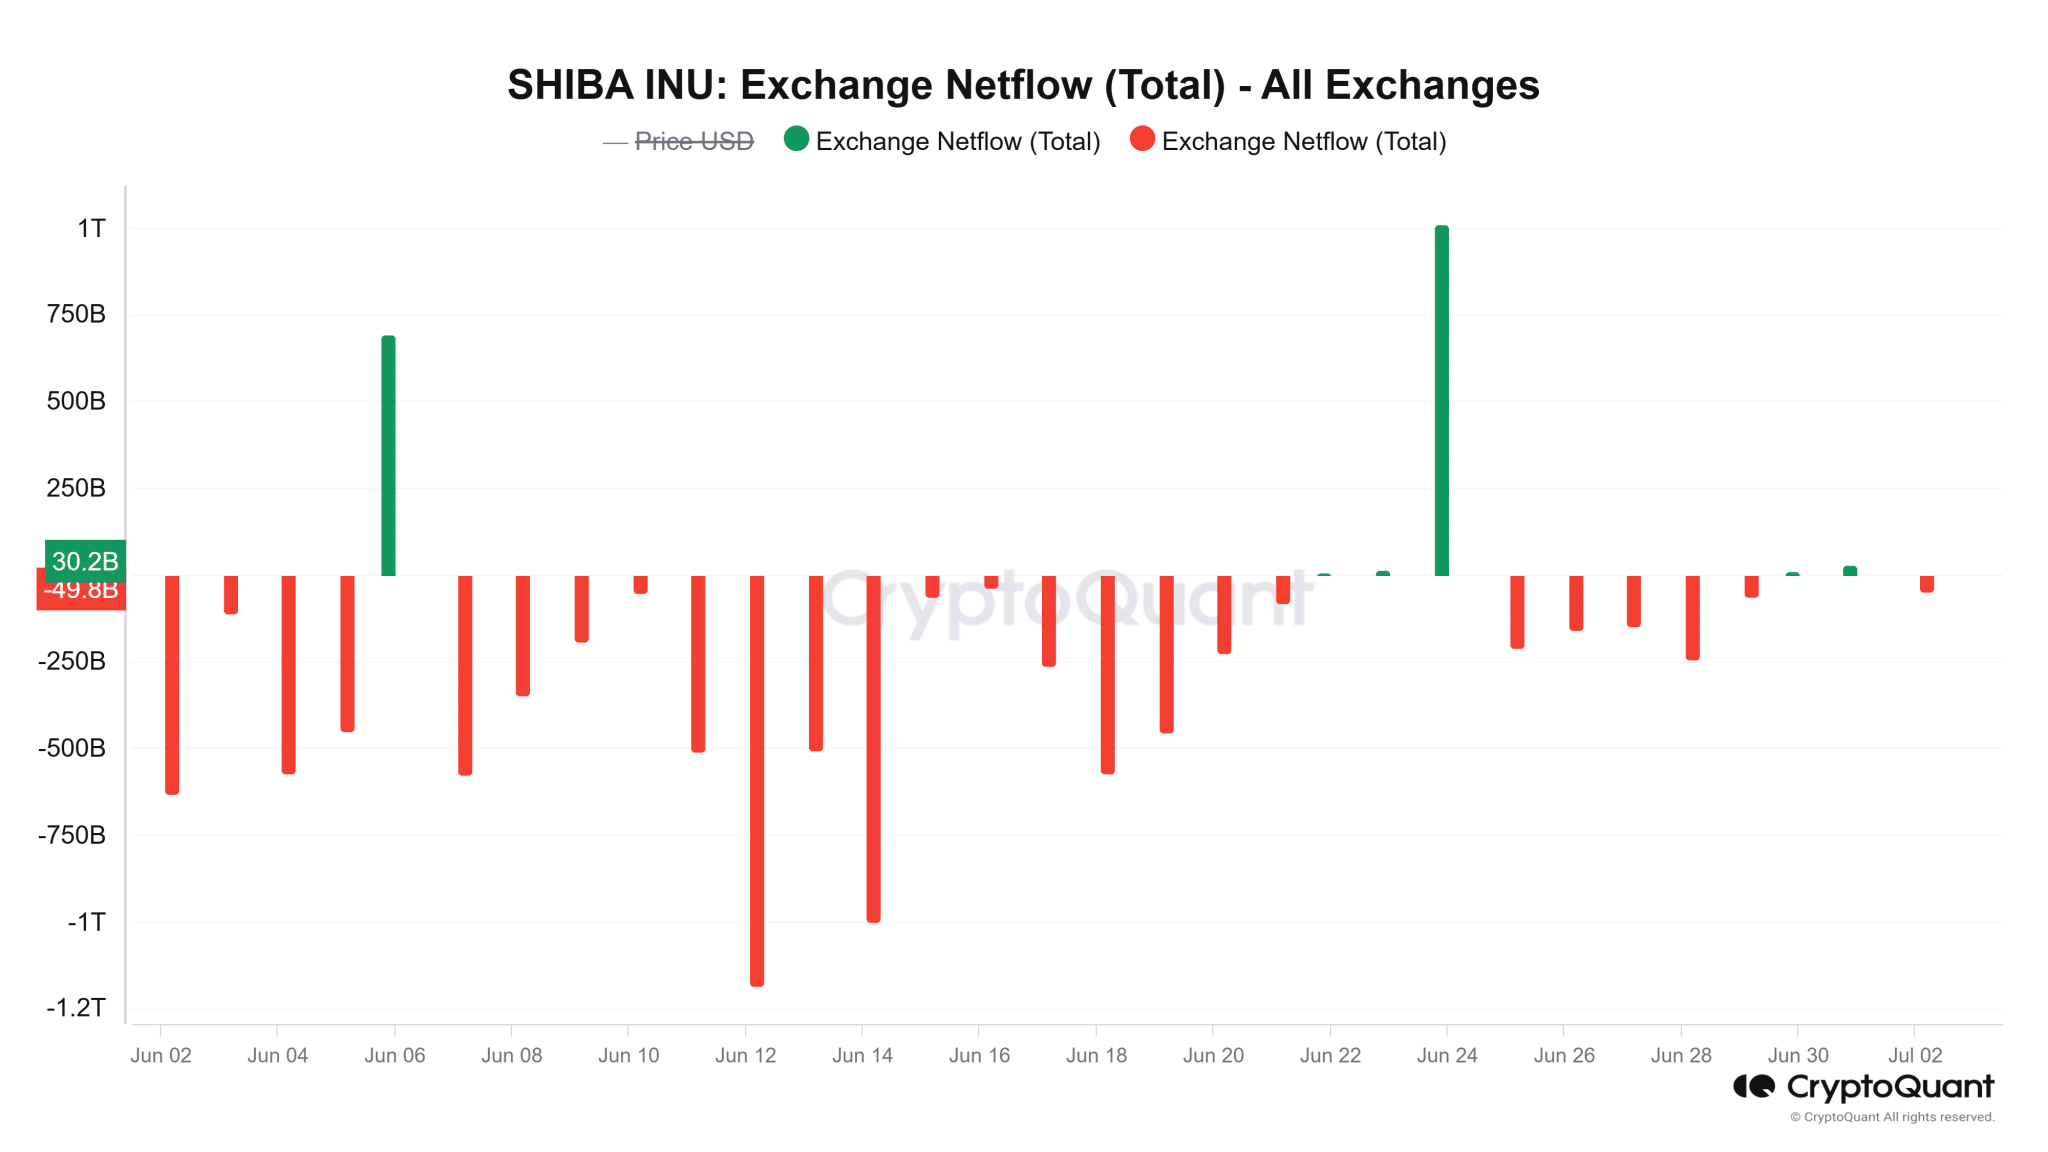
Shiba Inu could receive enough strength for such an upward push if the ongoing trend of exchange net outflows persist. CryptoQuant data shows that since June 2, SHIB has recorded 23 days of negative exchange flows. These outflows have exceeded 8.6 trillion Shiba Inu over the last month.
Meanwhile, despite starting July with a mild increase, SHIB is now down 0.45% this month. However, with its RSI currently at 33.68, the token hovers around oversold territories. Santiment also confirmed this in a recent report, stressing that Shiba Inu’s MVRV has dropped to -1.5.