The double-digit dip in Shiba Inu’s (SHIB) spot price in the last month has led to a significant decline in trading activity in its derivatives market.
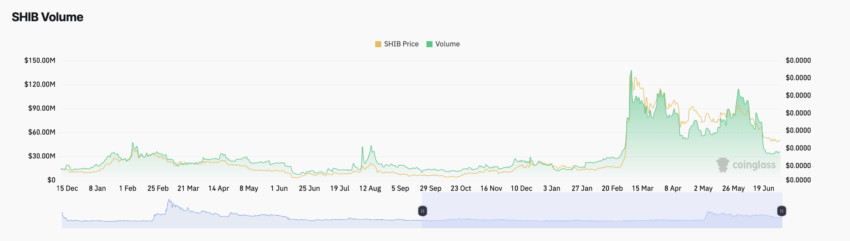
With $35.43 million recorded at press time, SHIB’s daily trading volume currently sits at a low last observed in February.
Shiba Inu Derivates Traders Exit Market
When an asset witnesses a decline in derivatives market trading volume, it generally indicates reduced speculative activity. This means that traders are less willing to take on risk or make bets on the asset’s future price movements.
SHIB’s daily derivatives market trading volume climbed to a year-to-date peak of $138 million on March 6 and has since trended downward.
It is key to note that a drop in derivatives trading activity often correlates with reduced price volatility. The drop in SHIB’s Average True Range (ATR) in the past few weeks confirms the decline in market volatility. At 0.0000011 at press time, SHIB’s ATR has dropped by 77% since March.
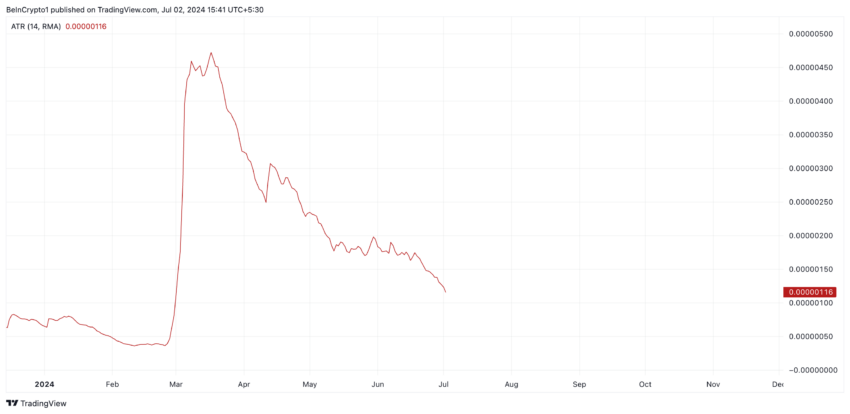
An asset’s ATR measures market volatility by calculating the average range between high and low prices over a specified number of periods.
When it declines, it suggests that the likelihood of price swings is becoming less significant.
Notably, despite the unabated decline in SHIB’s value and the low activity in its derivatives market, there is a continued demand for long positions. Readings from its funding rate show that it has remained predominantly positive in the past few months. SHIB’s funding rate across cryptocurrency exchanges is 0.0093% as of this writing.
Read More: How To Buy Shiba Inu (SHIB) and Everything You Need To Know
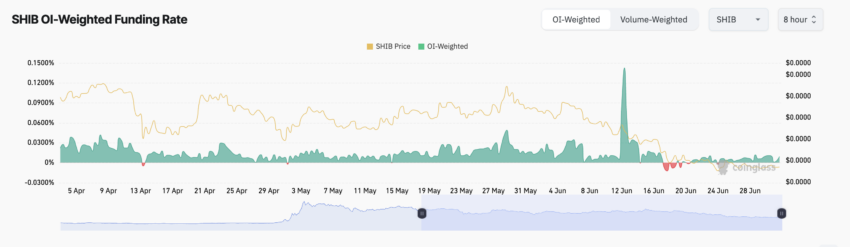
Funding rates are a mechanism used in perpetual futures contracts to ensure that the contract price stays close to the spot price.
When an asset’s funding rate is positive, more traders hold long positions, which is often regarded as a bullish signal.
SHIB Price Prediction: Selling Activity to Put Downward Pressure on Price
SHIB’s current price decline may continue as demand for the meme coin plunges. For example, its Relative Strength Index (RSI) is currently trending downward at 33.30.
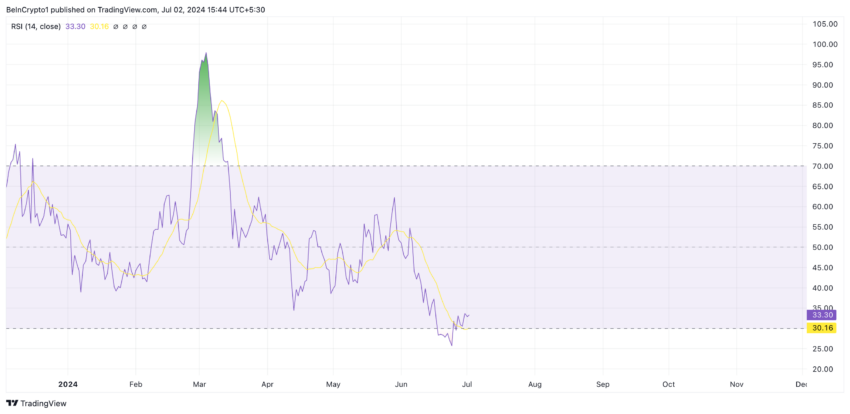
This indicator measures an asset’s overbought and oversold market conditions. It ranges between 0 and 100, with values above 70 suggesting that the asset is overbought and due for a decline. On the other hand, values under 30 indicate that the asset is oversold and may witness a rebound.
At 33.78 at press time, SHIB’s RSI signals an uptick in the meme coin’s selling pressure.
If coin holders continue to sell their holdings, SHIB’s price may drop to $0.000016.
Read More: Shiba Inu (SHIB) Price Prediction 2024/2025/2030
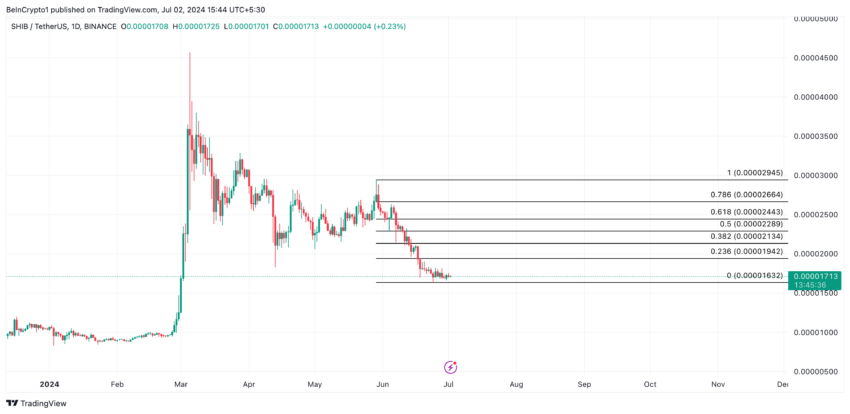
However, if sentiment shifts from bearish to bullish and buying activity climbs, SHIB’s value could rally toward $0.000019.