The surge in Fantom’s (FTM) price in the last 24 hours has caused most transactions involving the altcoin to end in profit.
With an 8% price uptick, Fantom ranks as the eighth cryptocurrency asset with the most gains during that period.
Fantom Rally Puts Holders in Gains
As of this writing, Fantom (FTM) trades at $0.59. The past 24 hours have also witnessed a spike in the coin’s trading volume. Totaling $116 million at press time, it has risen by 82% during the period in consideration.
The surge in FTM’s price has put many of its holders in gains in the last 24 hours. An assessment of FTM’s daily ratio of transaction volume in profit to loss shows that it has risen to 4.29, its highest level since April 8.
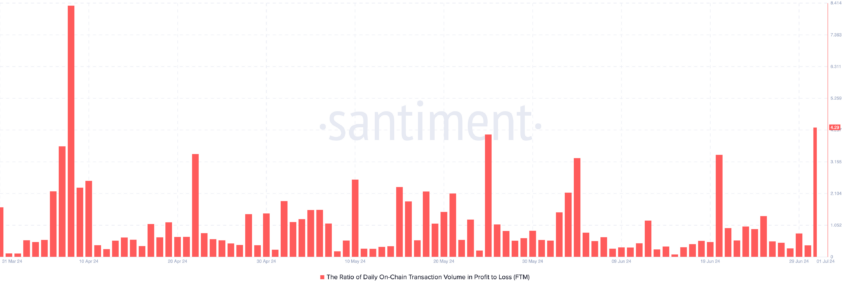
This metric measures the daily ratio of transaction volume in profit to loss. It compares the volume of transactions that result in a profit to those that end in a loss within a single day.
A high/positive ratio indicates that more transactions are being conducted at a profit, suggesting bullish sentiment. In comparison, a low/negative ratio implies more transactions end in a loss, indicating bearish sentiment.
A4 4.29, this metric implies that for every FTM transaction that returns a loss, 4.29 transactions end in a profit.
Despite this, most addresses holding FTM are “out of the money.” An address is said to be out of the money when the current price of an asset is lower than the average price at which it acquired the asset.
Currently, 52,600 addresses, representing 48% of all FTM holders, are currently in a loss position.
Read More: Top 5 Yield Farms on Fantom
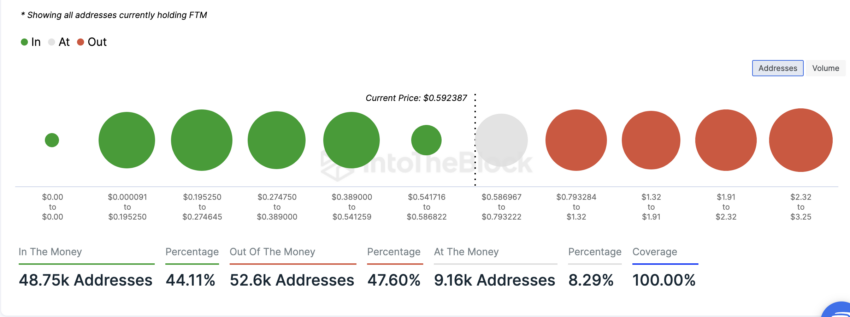
Conversely, 48,750 addresses, making up 44% of all coin holders, are “in the money,” meaning they are holding at a profit.
FTM Price Prediction: Buyers Propel Price Rally
Readings from the coin’s price movement on a one-day chart confirm the bullish bias toward FTM. Its Moving Average Convergence Divergence (MACD) initiated a bullish crossover on June 24, and the buyers have since been in control.
This indicator tracks an asset’s price momentum and identifies potential trend reversals. A bullish crossover occurs when the MACD line (blue) intersects the signal (orange) in an uptrend.
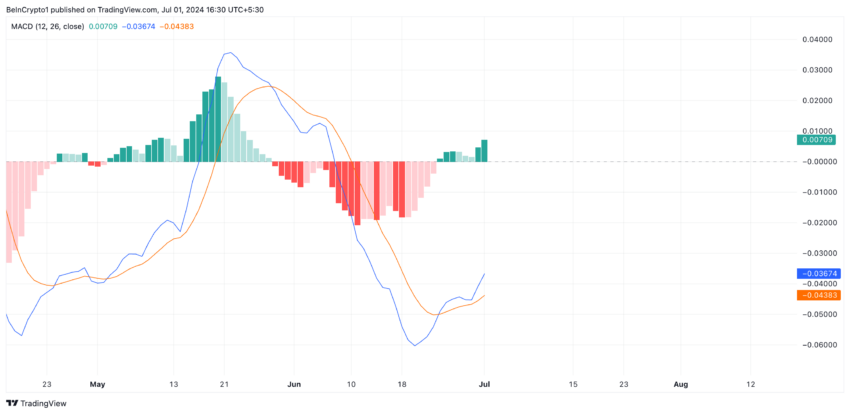
Fantom Analysis. Source: TradingView
When the MACD line crosses above the signal line, it is considered bullish. Traders view it as an opportunity to enter long positions in anticipation of further price increases.
If FTM buying pressure is sustained, the altcoin’s price might rally to $0.60.
Read More: 9 Best Fantom (FTM) Wallets In 2024
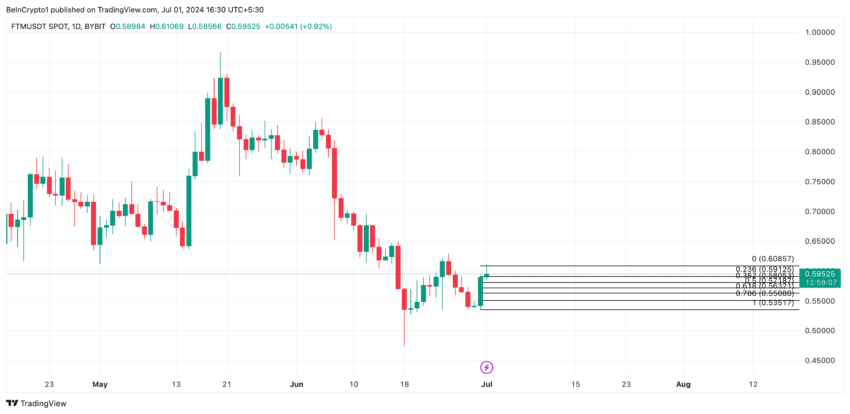
Fantom Analysis. Source: TradingView
However, if FTM holders begin to sell more due to the high profits from daily transactions, this may put downward pressure on its price, causing it to fall to $0.58.