Polkadot has surged towards a crucial resistance region, marked by the multi-month wedge’s upper boundary and the $6.4 threshold.
This area is likely filled with significant supply, potentially halting the upward momentum in the short term and leading to a temporary phase of sideways consolidation.
Technical Analysis
By Shayan
The Daily Chart
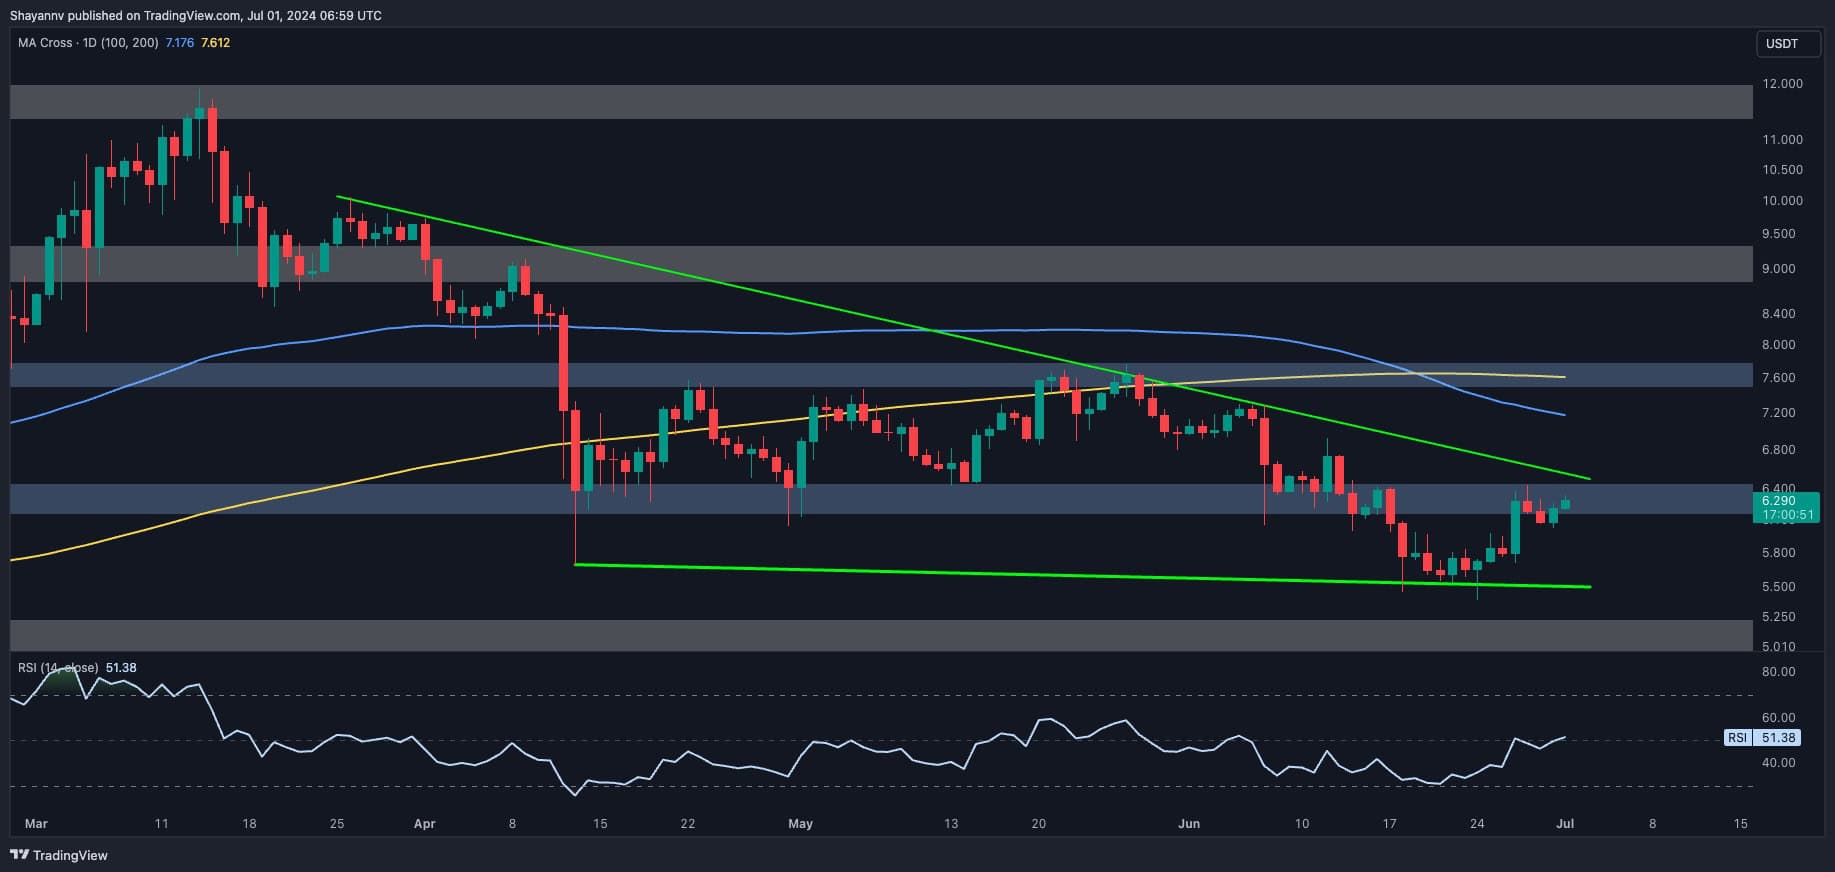
A detailed analysis of Polkadot’s daily chart shows a significant price surge from the $5.5 crucial support, likely driven by aggressive long positions in the perpetual markets.
This increase has propelled the price toward a substantial resistance region, where a successful breakout could lead to a notable shift in market sentiment. This resistance includes the multi-month wedge’s upper boundary at $6.49 and the static resistance region at $6.4.
Previously a significant demand zone, this area now acts as a substantial barrier, likely exerting notable selling pressure as the price approaches it from below. As a result, a temporary period of sideways consolidation is probable in the short term before the price embarks on its next major move.
The 4-Hour Chart
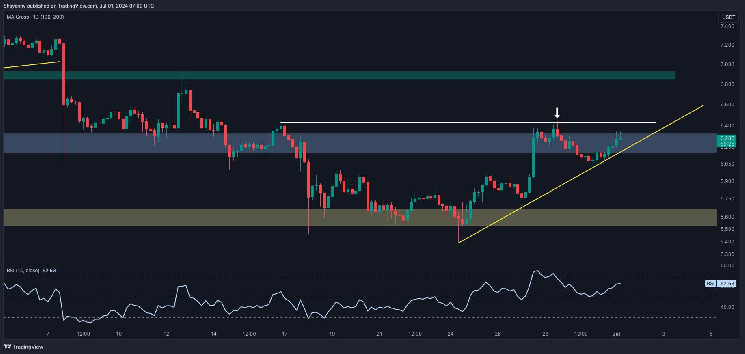
The 4-hour chart provides additional insights into Polkadot’s price action. After finding support near the $5.5 threshold, the cryptocurrency initiated a strong uptrend, forming higher highs and higher lows, indicating a bullish sentiment in this timeframe. This movement has established a bullish ascending trendline, supporting the recent rally.
However, the price has now reached a critical range, bounded by the resistance of its prior major swing high at $6.42 and the dynamic ascending trendline.
A breakout from this range is imminent and will clarify the direction of the next major trend. If the price faces a bearish rejection and breaches the uptrend, a consolidation phase within the $6.4-$5.5 price range is likely to follow.
Sentiment Analysis
By Shayan
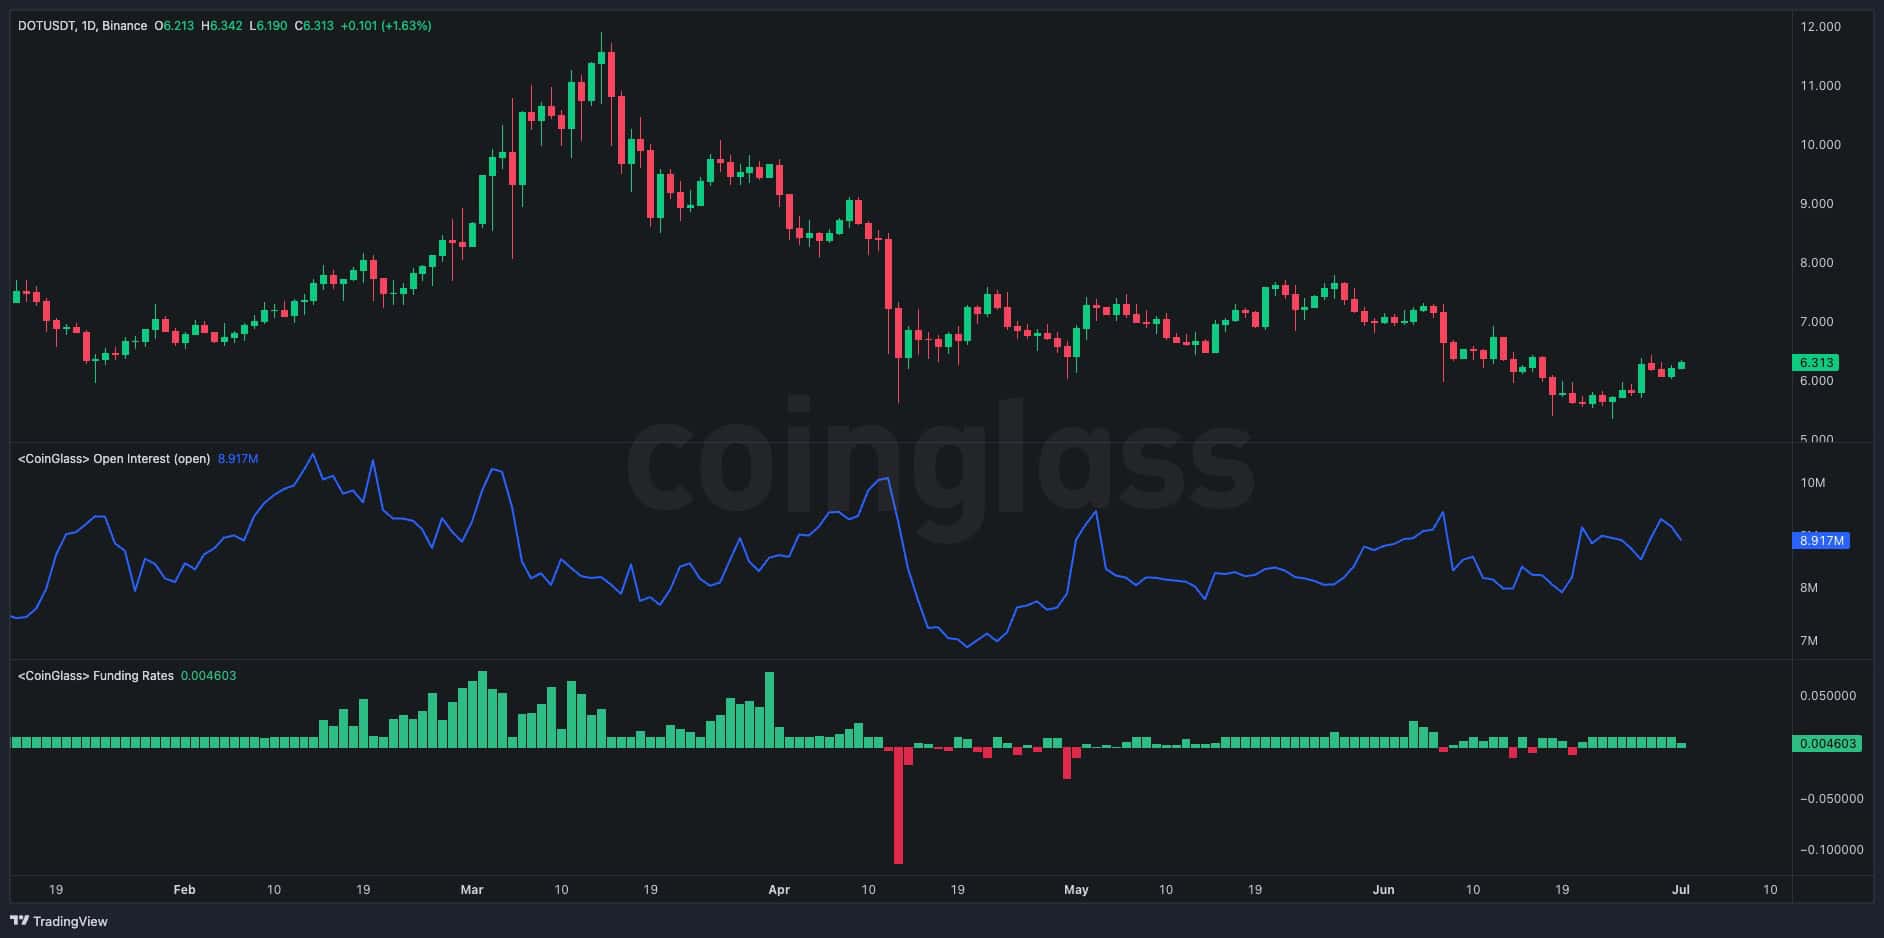
Polkadot has recently seen an uptick in demand, leading to a significant rise toward its previous major swing high of $6.4. Understanding the key drivers of this upswing will be crucial in determining whether the current uptrend will be sustained in the mid-term.
The accompanying chart illustrates Polkadot’s price, along with Open Interest (OI) and Funding Rate metrics. The recent bullish revival and slight uptrend were briefly driven by a moderate increase in buying activity in the perpetual markets, as indicated by a slight uptick in the OI metric and positive funding rates.
However, for the price to embark on a robust and sustained bullish trend, a significant increase in both OI and funding rates is necessary, similar to the conditions observed in March 2024. The current bullish momentum is not yet sufficient, and the market requires more buying activity in the futures market to maintain and strengthen the uptrend.