June closes in three days. So far, the broader crypto market has experienced a tumultuous period. Despite the market condition, a few coins reached new highs.
However, many have had to deal with considerable drawdowns. With July approaching, here are the top four cryptocurrencies that can hit new all-time highs before next month ends.
Binance Coin (BNB) Set Eyes on Massive Rebound
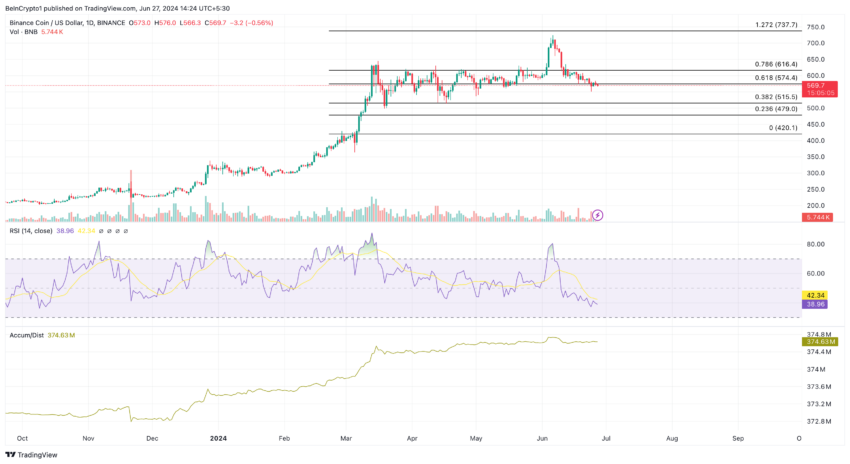
BNB, the exchange coin of Binance, is the first top 5 altcoin to surpass its previous all-time high. Since it reached $720.67 on June 6, the crypto has lost 21.11% of its value. Previously, BeInCrypto reported how BNB traded below crucial moving averages while struggling to recover.
However, things may change as time goes on. According to the BNB/USD daily chart, the Relative Strength Index (RSI), which measures momentum, trends downwards. However, the indicator seems to be heading in the oversold region direction.
Notably, a reading at 30 or below indicates that an asset is oversold. When it is 70 or above, it is overbought. As of this writing, the RSI positions at 38.96, indicating a further downtrend that may drive BNB’s price to $532.40.

Furthermore, the Accumulation/Distribution (A/D) indicator shows that distribution is not intense. As such, if BNB gets oversold, the price can rebound. In the event that buying pressure increases, the coin’s price may increase by 29.90%, which can produce news all-time highs toward $740.70 in July.
Kaspa (KAS) Seems Ready to Go Higher
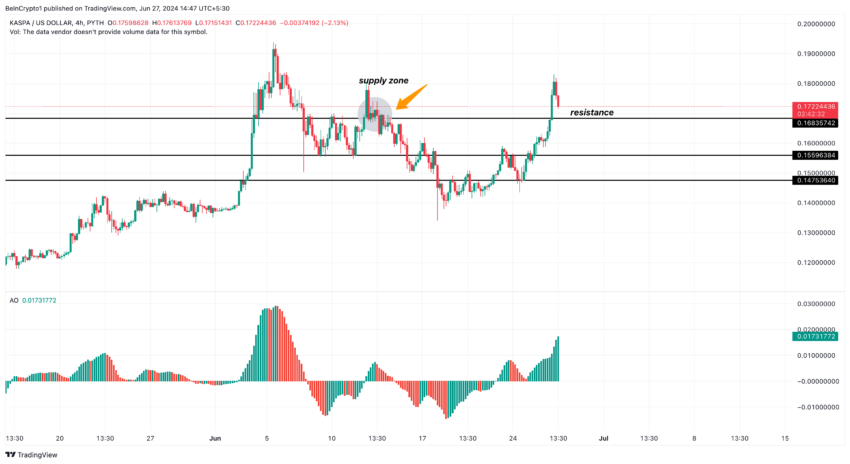
KAS is the native cryptocurrency of Kaspa Network, a Proof-of-Work (PoW)-based project that is different from traditional blockchains. Currently, KAS is only 9.61% down from its all-time high of $0.19.
Trading at $0.17, the token has gained 6.75% in the last 24 hours, while its trading volume has increased by a staggering 172.65%. The increase in trading volume clearly shows market interest in KAS.
On the 4-hour chart, bulls can be seen defending the $0.14 and $0.15 support. They also broke through the $0.16 resistance, a major supply zone with bearish interest on June 13.
A look at the Awesome Oscillator (AO), the technical oscillator that also tracks momentum, shows that KAS momentum is bullish. However, the token’s momentum seems to be waning.
Read More: What Is Altcoin Season? A Comprehensive Guide

The red candlesticks on the chart reveal this. As such, the KAS price can retest $0.16. But a rebound is possible. If this happens, the cryptocurrency’s value will likely hit $0.20 in July.
Pendle (PENDLE) Plans to Capitalize on Exhaustion
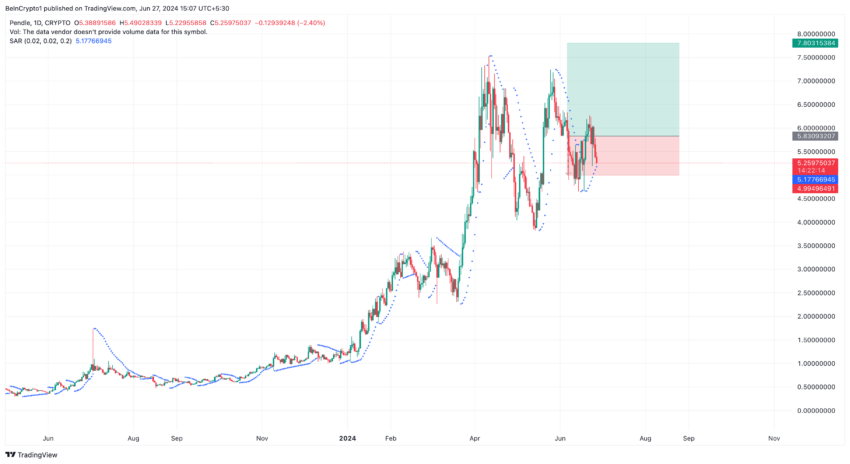
PENDLE, the decentralized liquidity protocol token, reached an all-time high of $7.52 on April 11. The token trades at $5.25, representing a 30.25% decrease from its peak. According to the daily chart, sellers are exhausted, meaning PENDLE may be set to erase some losses.
This is evident in the indications from the Parabolic SAR. This indicator spots prices that can be entry (buy) or exit (sell) signals. When the dotted lines are below the price, a bullish reversal is close. On the other hand, if the lines are above it, it means it is time to sell, and the price can decrease.

As of this writing, the Parabolic SAR is at $5.17, suggesting that PENDLE may soon bounce off the lows. In addition, market participants may take advantage of the discount. If this happens, PENDLE’s price may hit 7.80 before the end of next month.
In the meantime, traders must watch out for developments related to the project. For example, Pendle plans to unlock another round of tokens in a few days. This may cause high volatility around the token’s price. But if the dust settles later in the month, the price can begin to rise to new all-time highs.
Brett (BRETT) Bulls Provide Cover Against Bears
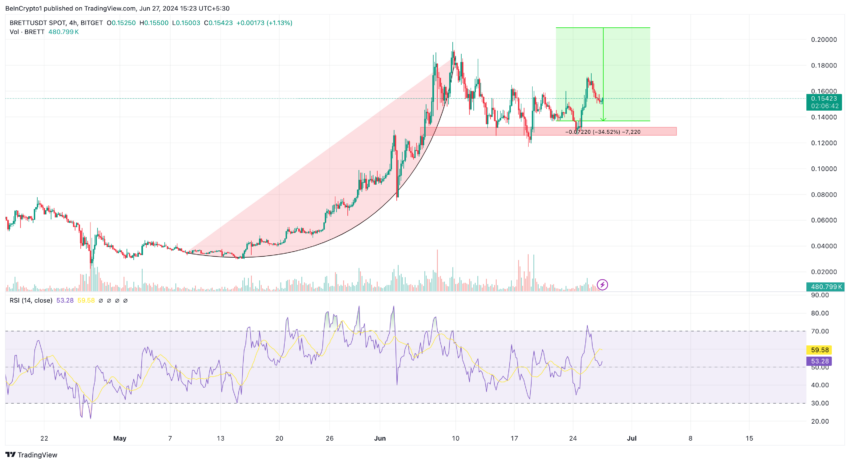
Last on the list is BRETT, the top crypto and meme coin developed on Coinbase layer-2 network Base. According to the 4-hour chart, BRETT formed a parabolic pattern between May 9 and June 9. During this time, the price went from $0.033 to $0.19.
However, the parabolic curve pattern formation indicates that the cryptocurrency hit saturation at its crest. Hence, it is expected that the price will reverse as BRETT currently trades at $0.15. Despite the decline, the RSI is able to refrain from falling below the 50.00 midpoint.
This proves that bulls are committed to defending the support at $0.13. Should this continue into next month, BRETT’s price can avoid going lower. If so, the price can test new all-time highs between $0.20 and $0.21.
Read More: What Are Meme Coins?

In conclusion, it is worth noting that these projected all-time highs are subject to market changes. If July becomes a far better month than June, these cryptos will most likely reach the aforementioned targets. However, if the market faces an uphill battle with bears, some of the forecasts may be invalidated.
 beincrypto.com
