As of 18 June 2024, the cryptocurrency market remains volatile, with Dogwifhat ($WIF) and Bonk ($BONK) capturing significant attention from investors. In this analysis, we will delve into the year-to-date (YTD) performance of $WIF-BTC, $WIF-USD, $BONK-BTC, and $BONK-USD pairs to determine, based on AI predictions, which cryptocurrency presents a better buying opportunity for the remainder of 2024.
WIF-BTC Analysis

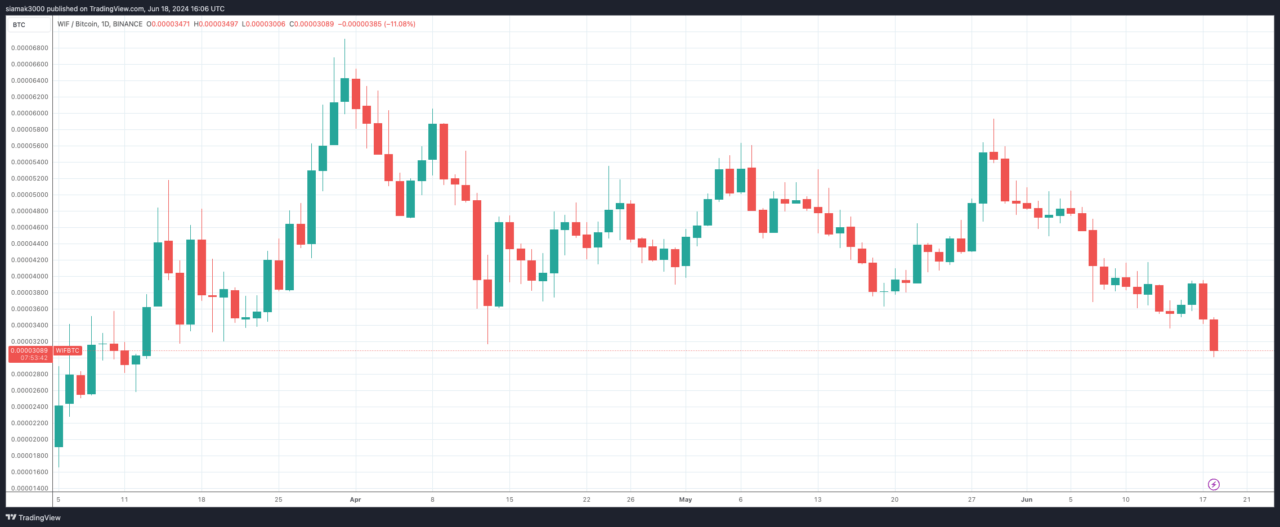
Dogwifhat’s performance against Bitcoin has been marked by significant fluctuations. Starting the year at very low levels, $WIF experienced a substantial rally in March, reaching a peak before correcting. As of mid-June, $WIF is trading around 0.00000003471 BTC.
The chart indicates potential support around the current levels, but the overall trend suggests caution. Investors should look for consolidation above 0.0000000400 BTC to confirm a potential upward trend.
WIF-USD Analysis

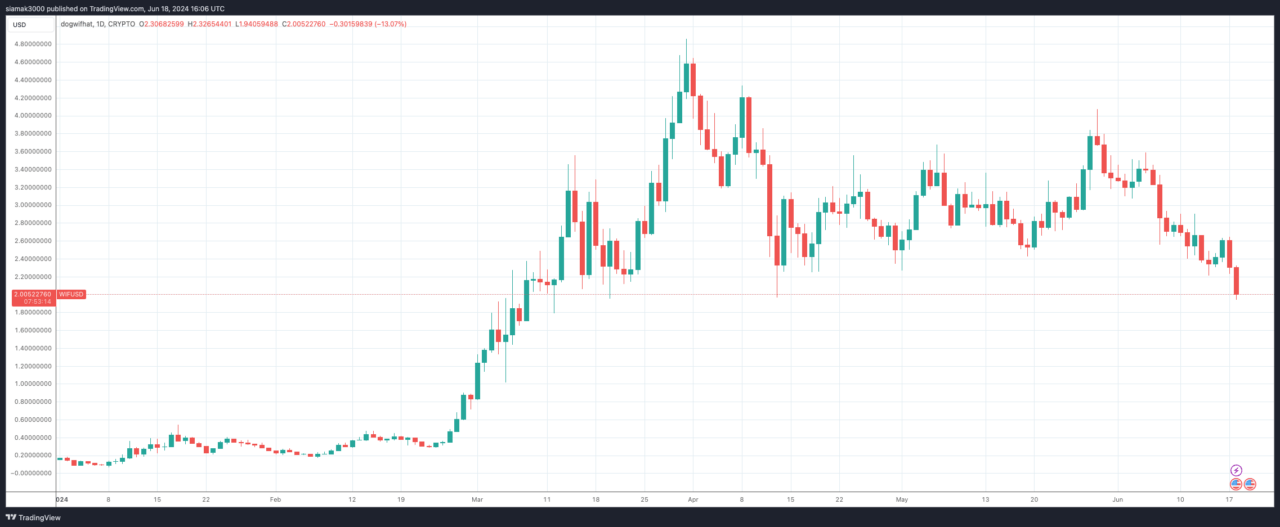
The $WIF-USD chart shows significant volatility similar to its BTC pair. Starting the year at extremely low levels, $WIF surged dramatically in March, reaching up to $4.8 before correcting to around $2.00 in mid-June.
Despite the correction, recent price action suggests a potential rebound if support at current levels holds. Investors should watch for a sustained move above $2.50 to confirm bullish interest.
BONK-BTC Analysis

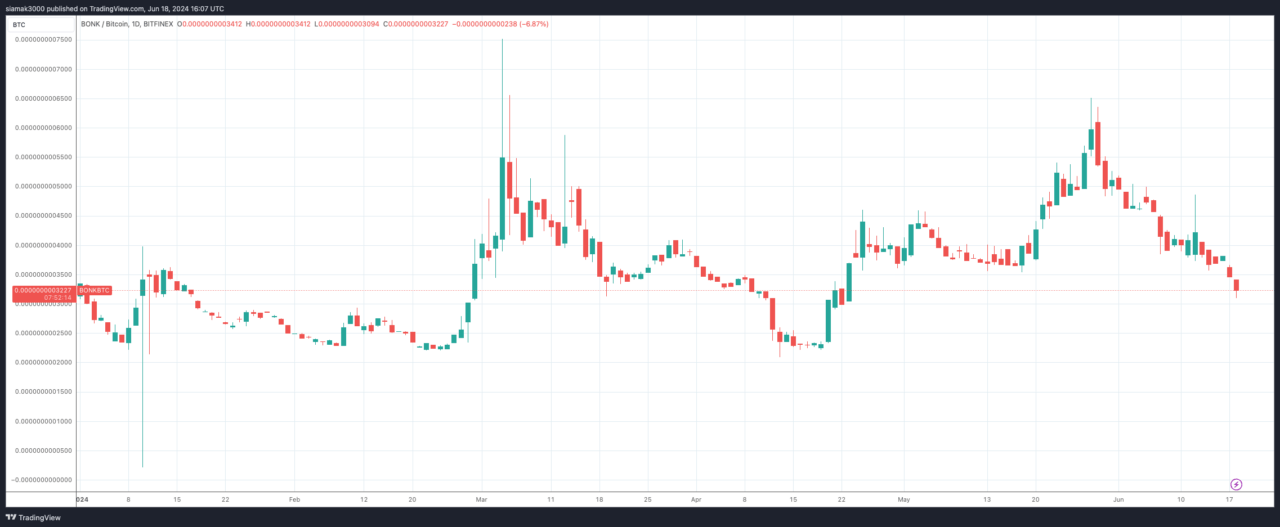
The BONK-BTC chart shows significant volatility for Bonk against Bitcoin. Starting the year at a lower point, BONK experienced a notable rally in March, reaching a peak before a significant correction. The price has since settled around 0.000000003227 BTC as of mid-June.
The chart indicates that BONK has strong support around the current levels, but the bearish trend suggests caution. Investors should look for sustained movements above 0.000000004000 BTC to confirm a potential trend reversal.
BONK-USD Analysis

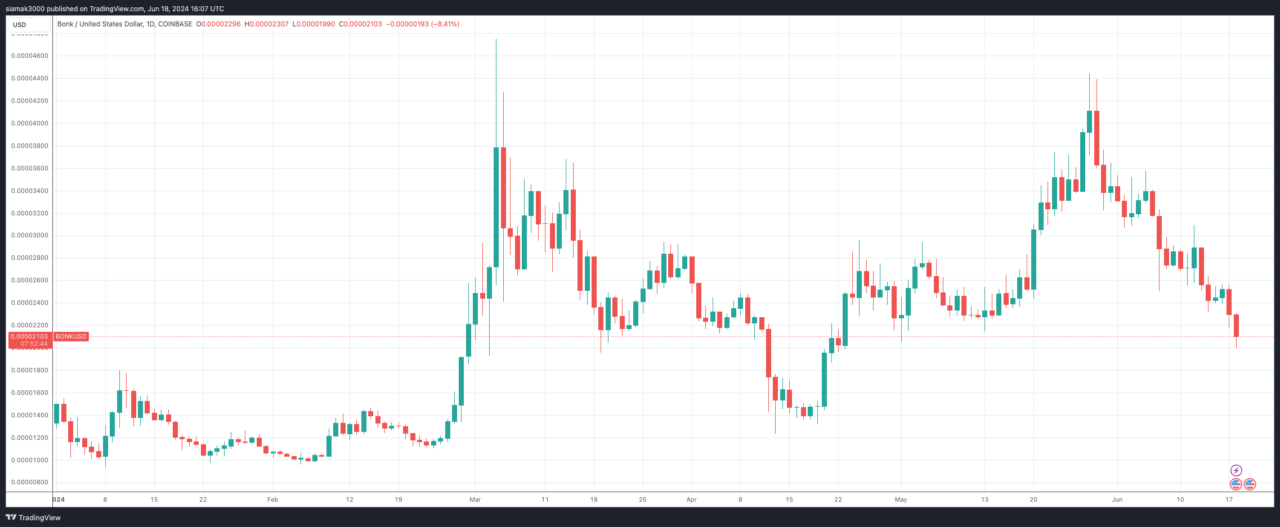
The BONK-USD chart reflects Bonk’s volatile journey throughout the year. Starting at around $0.0000008, BONK saw a dramatic increase in March, reaching up to $0.0000035 before a steep correction brought the price back down to approximately $0.0000021 in mid-June.
The chart shows strong support around $0.0000020, and the recent bounce back suggests potential for upward movement. Investors should watch for sustained trading above $0.0000025 to confirm bullish momentum.
Conclusion
-
Dogwifhat ($WIF):
- WIF-USD: $WIF saw dramatic gains from extremely low levels to $4.8 but corrected to around $2.00. While there is potential for a rebound, the overall trend remains volatile and uncertain without clear support levels being firmly established.
- WIF-BTC: Similar to the USD pair, $WIF showed significant fluctuations, with potential support around 0.00000003471 BTC. The trend remains cautious without clear consolidation above 0.0000000400 BTC.
-
Bonk ($BONK):
- BONK-USD: BONK started the year at around $0.0000008 and experienced a significant rally to $0.0000035 in March, indicating strong bullish interest. Despite the correction, the price has found support around $0.0000020 and recently bounced back to $0.0000021. This resilience suggests that BONK has strong support at lower levels and potential for upward movement if it can sustain trading above $0.0000025.
- BONK-BTC: BONK showed similar patterns of volatility against Bitcoin, with a notable rally and subsequent correction. The current price around 0.000000003227 BTC suggests support at these levels, but the overall trend remains cautious unless it moves above 0.000000004000 BTC.
Given the current market conditions and the analysis provided, Bonk ($BONK) appears to be the safer and potentially more rewarding investment for the remainder of 2024. This conclusion is based on BONK’s stronger support levels, resilience in bouncing back after corrections, and the potential for upward movement if it sustains trading above key resistance levels. However, as always, investors should conduct their own research and consider their risk tolerance before making any investment decisions.
Important Warning: This analysis and prediction were generated by AI. The cryptocurrency market is extremely volatile, and this post should not be considered financial advice of any kind. Readers should be aware of the very high risks involved in cryptocurrency investments and conduct their own research or consult with a financial advisor before making any investment decisions. Do not base any financial decisions solely on this analysis.
Featured Image via Unsplash
 cryptoglobe.com