Arbitrum’s (ARB) price drop below $1 may have provided an opportunity that has not appeared for some time. As of this writing, the token’s price was $0.94, a 56.90% decrease in 90 days.
However, according to data found on-chain and the technical perspective, ARB may erase some of these losses.
Whales Are Buying Arbitrum Again
One metric fueling the bullish prediction is the action of whales. Whales are entities or individuals that hold a large amount of a token. Because of this large supply of tokens owned, whales can significantly influence market prices.
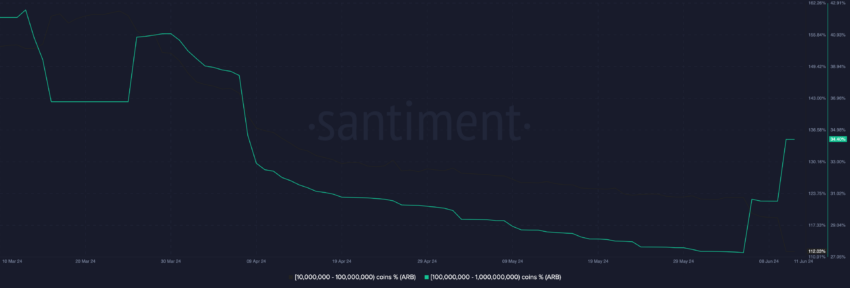
According to the on-chain analytic platform Santiment, addresses holding 100 million to 1 billion ARB tokens have accumulated more since June 5. For instance, the supply of this cohort was 27.19% on the aforementioned date.

However, the ratio has increased to 34.40. Specifically, whales purchased 251.79 million Arbitrum tokens on June 10. The difference in this supply indicates that Arbitrum’s price may begin a slow movement up the charts.
Read More: Arbitrum (ARB) Price Prediction 2024/2025/2035
Some weeks back, BeInCrypto reported how ARB flashed a buy signal. However, indicators at that time suggested that the timing was off. Hence, the bullish bias could not be validated.
This time, the condition may be different. This is because of the concentration of Arbitrum’s large holders.
Data from IntoTheBlock shows that 88% of ARB holders are losing money at the current price, while only 4% of the total holders are making gains.
Furthermore, 83% of holders own the token in large numbers. The high concentration of ARB among whale addresses means that increased accumulation may drive higher prices.

On the other hand, a widespread sell-off by these addresses may cause a significant price increase. Considering the rise in buying pressure, ARB may approach the key resistance level that it reached on May 21.
ARB Price Prediction: A Rebound May be Close
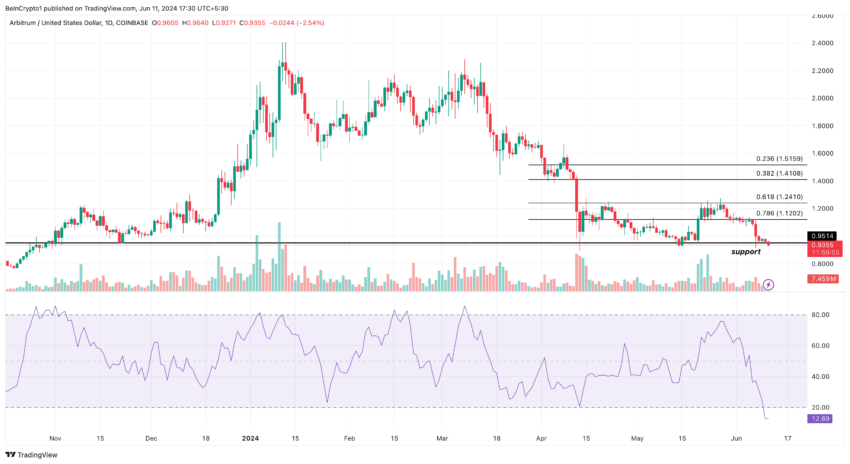
From a technical point of view, the daily chart shows the Money Flow Index (MFI) reading dropping to 12.69. The MFI uses price and volume to measure the buying and selling pressure around a cryptocurrency.
When the Money Flow Flow Index is below 20.00, it means that the cryptocurrency is oversold. Conversely, a reading above 80.00 suggests the token is overbought.
Therefore, the MFI reading as of this writing, indicates that ARB is oversold. In addition, ARB is at the support floor of $0.94. Hence, the price may bounce off the lows to the resistance level position at $1.12.

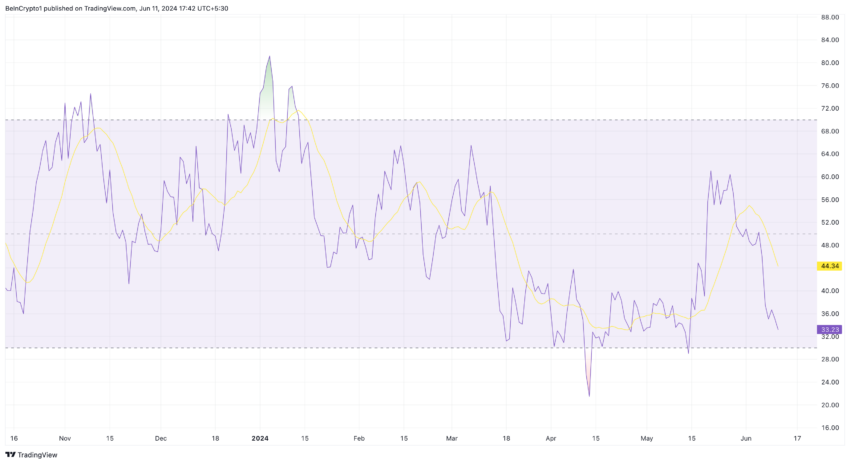
In addition, the Relative Strength Index (RSI) aligns with the prediction backed by the MFI. The RSI, as an oscillator, measures momentum.
It also shows if a cryptocurrency is oversold or overbought. When the reading is below 30, it means that a token is oversold. However, a reading above 70 indicates an overbought condition.
Read More: How to Buy Arbitrum (ARB) and Everything You Need to Know
As of this writing, the RSI was 33.21. This reinforces the notion that ARB is around the oversold region. Hence, the price may bounce and trade at $1.12 in the short term. In a highly bullish scenario, ARB may rise to $1.24.

However, this bullish thesis may be invalidated if selling pressure increases. If this happens, ARB may slip below $0.90. Another factor that can affect ARB’s price is Ethereum (ETH).
ETH and ARB strongly correlate because of Arbitrum’s layer-2 operation on the Ethereum blockchain. Should ETH’s price jump, ARB may follow. On the other hand, a further decrease in ETH’s value may send ARB down the charts.
 beincrypto.com