Data shows that the Shiba Inu price has closely followed Bitcoin price movements more than any other asset, with $SHIB and $BTC boasting the highest price correlation matrix over the last 30 days.
Shiba Inu ($SHIB) has been a beneficiary and victim of broader market trends depending on their direction. When the market records an uptrend, Shiba Inu typically records price upswings. However, during a market downtrend, $SHIB witnesses substantial declines.
Shiba Inu Trails Bitcoin
This pattern has prevailed throughout this year, with a notable impact in late April. Bitcoin dropped 15% from a $66,000 high on April 23 to a $56,000 floor price on May 1. This value represented Bitcoin’s lowest price in three months.
Interestingly, Shiba Inu followed a similar trail, having collapsed from $0.00002689 on April 23 to a low of $0.00002057 on May 1. This marked a 23.5% drop within the same period that Bitcoin recorded similar downward pressure. The price drop witnessed by Shiba Inu and Bitcoin is a product of their strong correlation.
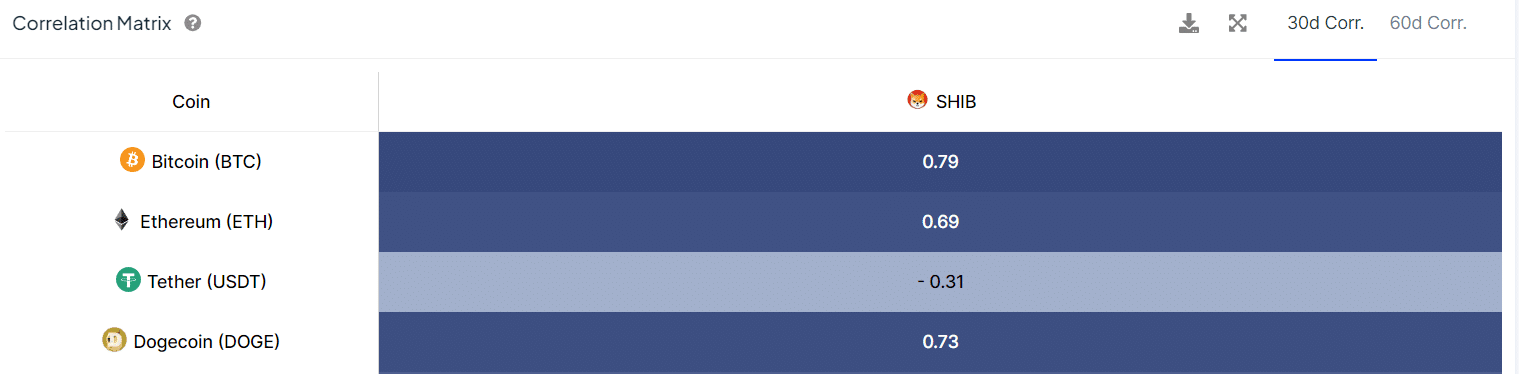
Shiba Inu Price Correlation with $BTC
Market data sourced by IntoTheBlock shows that Shiba Inu boasts a 79% correlation with Bitcoin in the last 30 days. This indicates that Shiba Inu’s price movements have had a strong positive correlation with Bitcoin’s price movements. In contrast, Cardano (ADA) only has a 62% correlation with Bitcoin within this period.
While this trend can be positive for Shiba Inu, it also paints a concerning picture. For instance, if Bitcoin faces turbulence due to market headwinds, $SHIB is not likely to buck the overall market trend. This is observed in recent price action, where Shiba Inu has now dropped alongside $BTC.
Bitcoin faced major resistance at the $70,000 level yesterday, resulting in a drop toward $68,000. This drop has impacted Shiba Inu’s price, compounding the existing bearish pressure it already faces. $SHIB has recorded six consecutive losing days since May 30, down 6.17% this month.
The Crypto Basic confirmed earlier that Shiba Inu has a history of recording losses in June. Notably, Bitcoin has not recorded as much loss as Shiba Inu during the ongoing downturn due to its greater resilience. $SHIB typically features higher volatility. As a result, during market declines, it faces steeper drops.
However, this also means that Shiba Inu witnesses higher price surges during an uptrend. For instance, $SHIB spiked 370% between late February and early March to $0.000045. Meanwhile, Bitcoin only saw a 33% increase within this timeframe.
Shiba Inu Price Poised for Follow $BTC’s Upsurge
$SHIB’s high correlation with $BTC is a generally positive sign, especially with Bitcoin poised to reach greater heights. As a result, analysts who have projected lofty $BTC prices for this market cycle also believe Shiba Inu would record greater rallies. Market pundit Armando Pantoja expects $SHIB to hit $0.001 when $BTC reaches $100,000 to $250,000.
Meanwhile, Shiba Inu only has a 69% price correlation with Ethereum (ETH) and a 73% correlation with Dogecoin (DOGE). $SHIB currently trades for $0.00002383, with its Accumulation/Distribution metric indicating a sharp drop in investor holdings, having collapsed from 28 trillion $SHIB on May 28 to the current figure of 12.6 trillion.