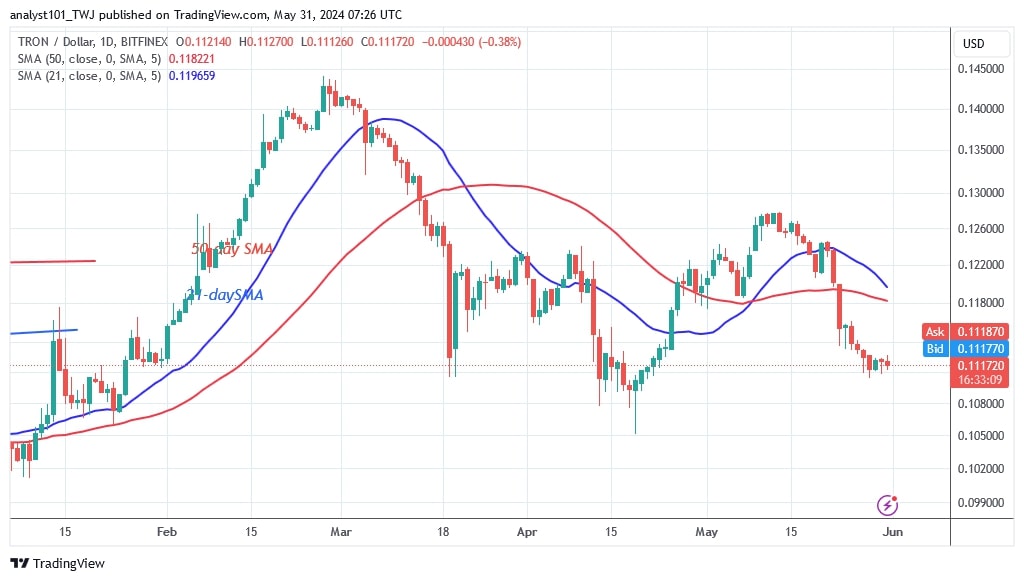
The price of TRON (TRX) has dropped below the moving average lines and has reached the previous low of $0.111.
Long-term forecast for TRON price: bearish
The bearish momentum could continue to the low of $0.109 and attract more buyers at lower price levels. During the previous decline, bears drove TRON to lows of $0.110 and $0.107 while bulls bought on dips. Today's price decline has reached the historical price level of January 30, 2024.
On April 13 and 19, the bears pushed the altcoin to a low of $0.109 while the bulls bought the drop. Currently, TRON is consolidating above the support of $0.110. The altcoin will rally if it maintains the current support. The market has returned above these support levels since January 2024. The altcoin has fallen into oversold territory.
TRON indicator reading
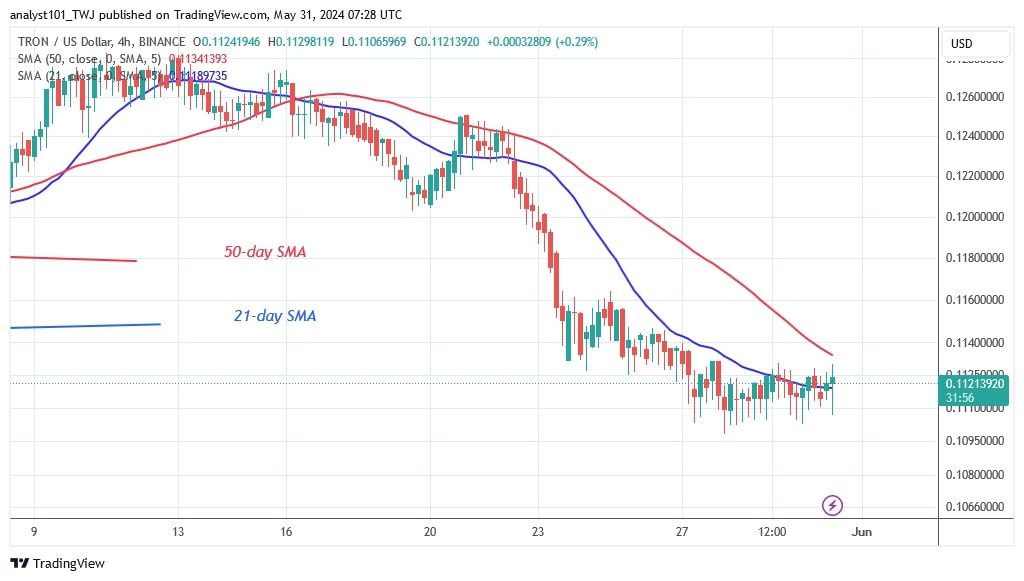
TRON has entered a bearish exhaustion with the price bars below the moving average lines. On the 4-hour chart, the price bars are between the moving average lines, so TRX may be forced to oscillate between them. The doji candlesticks with their small bodies and indecisive nature dominate the price action.
Technical indicators
Key supply zones: $0.13, $0.14, $0.15
Key demand zones: $0.10, $0.09, $0.08

What is the next move for TRON?
TRON has fallen into the oversold category of the market. Since March 19, the current support level of $0.110 has held. If the bulls buy the dips, the altcoin will resume its uptrend. On the 4-hour chart, the price of the cryptocurrency has resumed a positive trend after rising above the 21-day SMA.

Disclaimer. This analysis and forecast are the personal opinions of the author and are not a recommendation to buy or sell cryptocurrency and should not be viewed as an endorsement by CoinIdol.com. Readers should do their research before investing in funds.
 coinidol.com
