- Kusama price analysis is bullish today.
- KSM found strong support at $317.
- Strong resistance is present at $336.
The Kusama price analysis reveals that the price broke out upwards today. The bulls covered a wide range beginning at $317 and ending at $338. However, because selling pressure is quite strong at this point, and KSM/USD has dropped to settle at $334, the resistance near $336 does not appear to be an easy mark to maintain for the bulls.
Kusama price analysis – Source: Tradingview.com KSM forecast The price is likely to break out again at 1800GMT, but this may not last very long either because of strong selling pressure, which will weigh heavily on the Kusama price prediction at $337. If there are losses after another drop following this breakout,
The crypto market as a whole is bright today, with most cryptocurrencies posting gains over the last 24 hours, including Bitcoin‘s king, Ethereum, Tether, and numerous altcoins. The Binance Coin and Axie Infinity are top gainers, with eight percent and 10 percent rises.
KSM/USD 1-day price chart: Bulls feel defenseless as bears reject further growth
The price of KSM/USD rose dramatically at the start of today’s trading session. However selling pressure is tremendous in the market for KSM/USD, and the cost is declining again after reaching $338.
The volatility is modest, but it is slowly increasing as the Bollinger bands’ upper and lower bands are both at $457. The mean average line of the Bollinger bands is above the price level.
The relative strength index (RSI) is in the lower half of the neutral zone, with a score of 46, but the indicator’s movement is still upwards, implying that the support above $317 is adequate and can counteract the selling activity, which began in recent hours.
The MACD is still negative, as the price trend line has not altered, and the histogram remains bearish since the light, but taller bars show a declining bearish momentum; nevertheless, the indicator shows decreasing bearish momentum. Since 16th September, when the price trend changed direction and headed towards the lower side, the MACD has remained bear.
Kusama price analysis: Bulls to rely on $317 support again
The 4-hour price chart for Kusama price analysis reveals that the market is once again dominated by bears, as selling pressure is building with time and the KSM/USD value is declining. The hourly price movement appears to be repeating itself, with today’s rise beginning near the top end of the Bollinger bands and then returning below them, much as it did on 18th September.
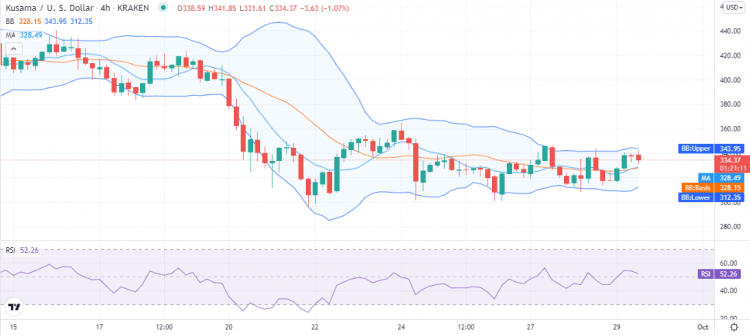 KSM/USD 4-hours price chart. Source: Tradingview
The volatility is mild on the hourly charts, but at the same time, the price swing is high as it is again traveling down towards the mean line of the Bollinger bands, and there are imminent chances of it crossing it down towards today’s support level. As can be seen in the 4-hour chart, the relative strength index (RSI) has also taken a downward curve, hinting at a drop to follow in the coming hours.
The most recent price trend line is flat, too; the Kusama price analysis recommends that bulls remain patient and wait for a breakout above $337 (which may not occur). However, if the Kusama price prediction were to drop below S1 at $317, most traders will be watching that level closely for a return of bullish sentiment.
The market for Kusama is currently experiencing a great deal of selling pressure, as indicated by the Bollinger bands which are rapidly narrowing. The KSM/USD value reached a high today of $338 but has since returned to $334.
The RSI is slightly above 50 and moving downwards, meaning that the bulls are losing their strength and the bears are gaining an upper hand in the market. The MACD is also negative and has been decreasing in height since 16th September, when the price trend reversed from its bullish direction.
The Kusama Price Analysis: Conclusion
According to the Kusama price analysis, KSM/USD is in a shaky position. Today, we expect the KSM/USD pair price to fall back to $317 support; anything lower would not be surprising. However, as can be seen, over the previous few days, the Kusama price function has established a movement pattern, and the price has maintained a position above the lower band of the Bollinger bands. As long as the price is within this area, then there will be some hope that bulls can protect $317 support.
Disclaimer. The information provided is not trading advice. Cryptopolitan.com holds no liability for any investments made based on the information provided on this page. We strongly recommend independent research and/or consultation with a qualified professional before making any investment decisions.