Polkadot’s price is still moving rangebound, following its significant decline in April. On a more minor scale, the asset has declined by more than 3% in the past 24 hours, in a move perhaps fueled by the developments around the SEC and the recently approved spot Ethereum ETFs.
Meanwhile, the broader market is currently in a critical spot.
Technical Analysis
By TradingRage
The Daily Chart
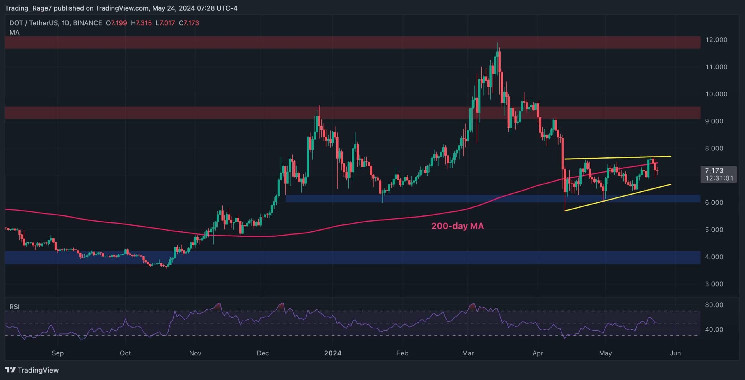
The DOT price has been consolidating inside a flag pattern over the last month and hovering around the 200-day moving average. With the $6 level holding firm, the price is trying to break above the 200-day moving average around the $7.5 level.
The higher boundary of the pattern is also being tested. If the price successfully breaks above these obstacles, a new bullish run toward the $9 level and even higher would be probable.
DOT came close to doing so this week, but the bears provided strong resistance at the $7.5 level.

The 4-Hour Chart
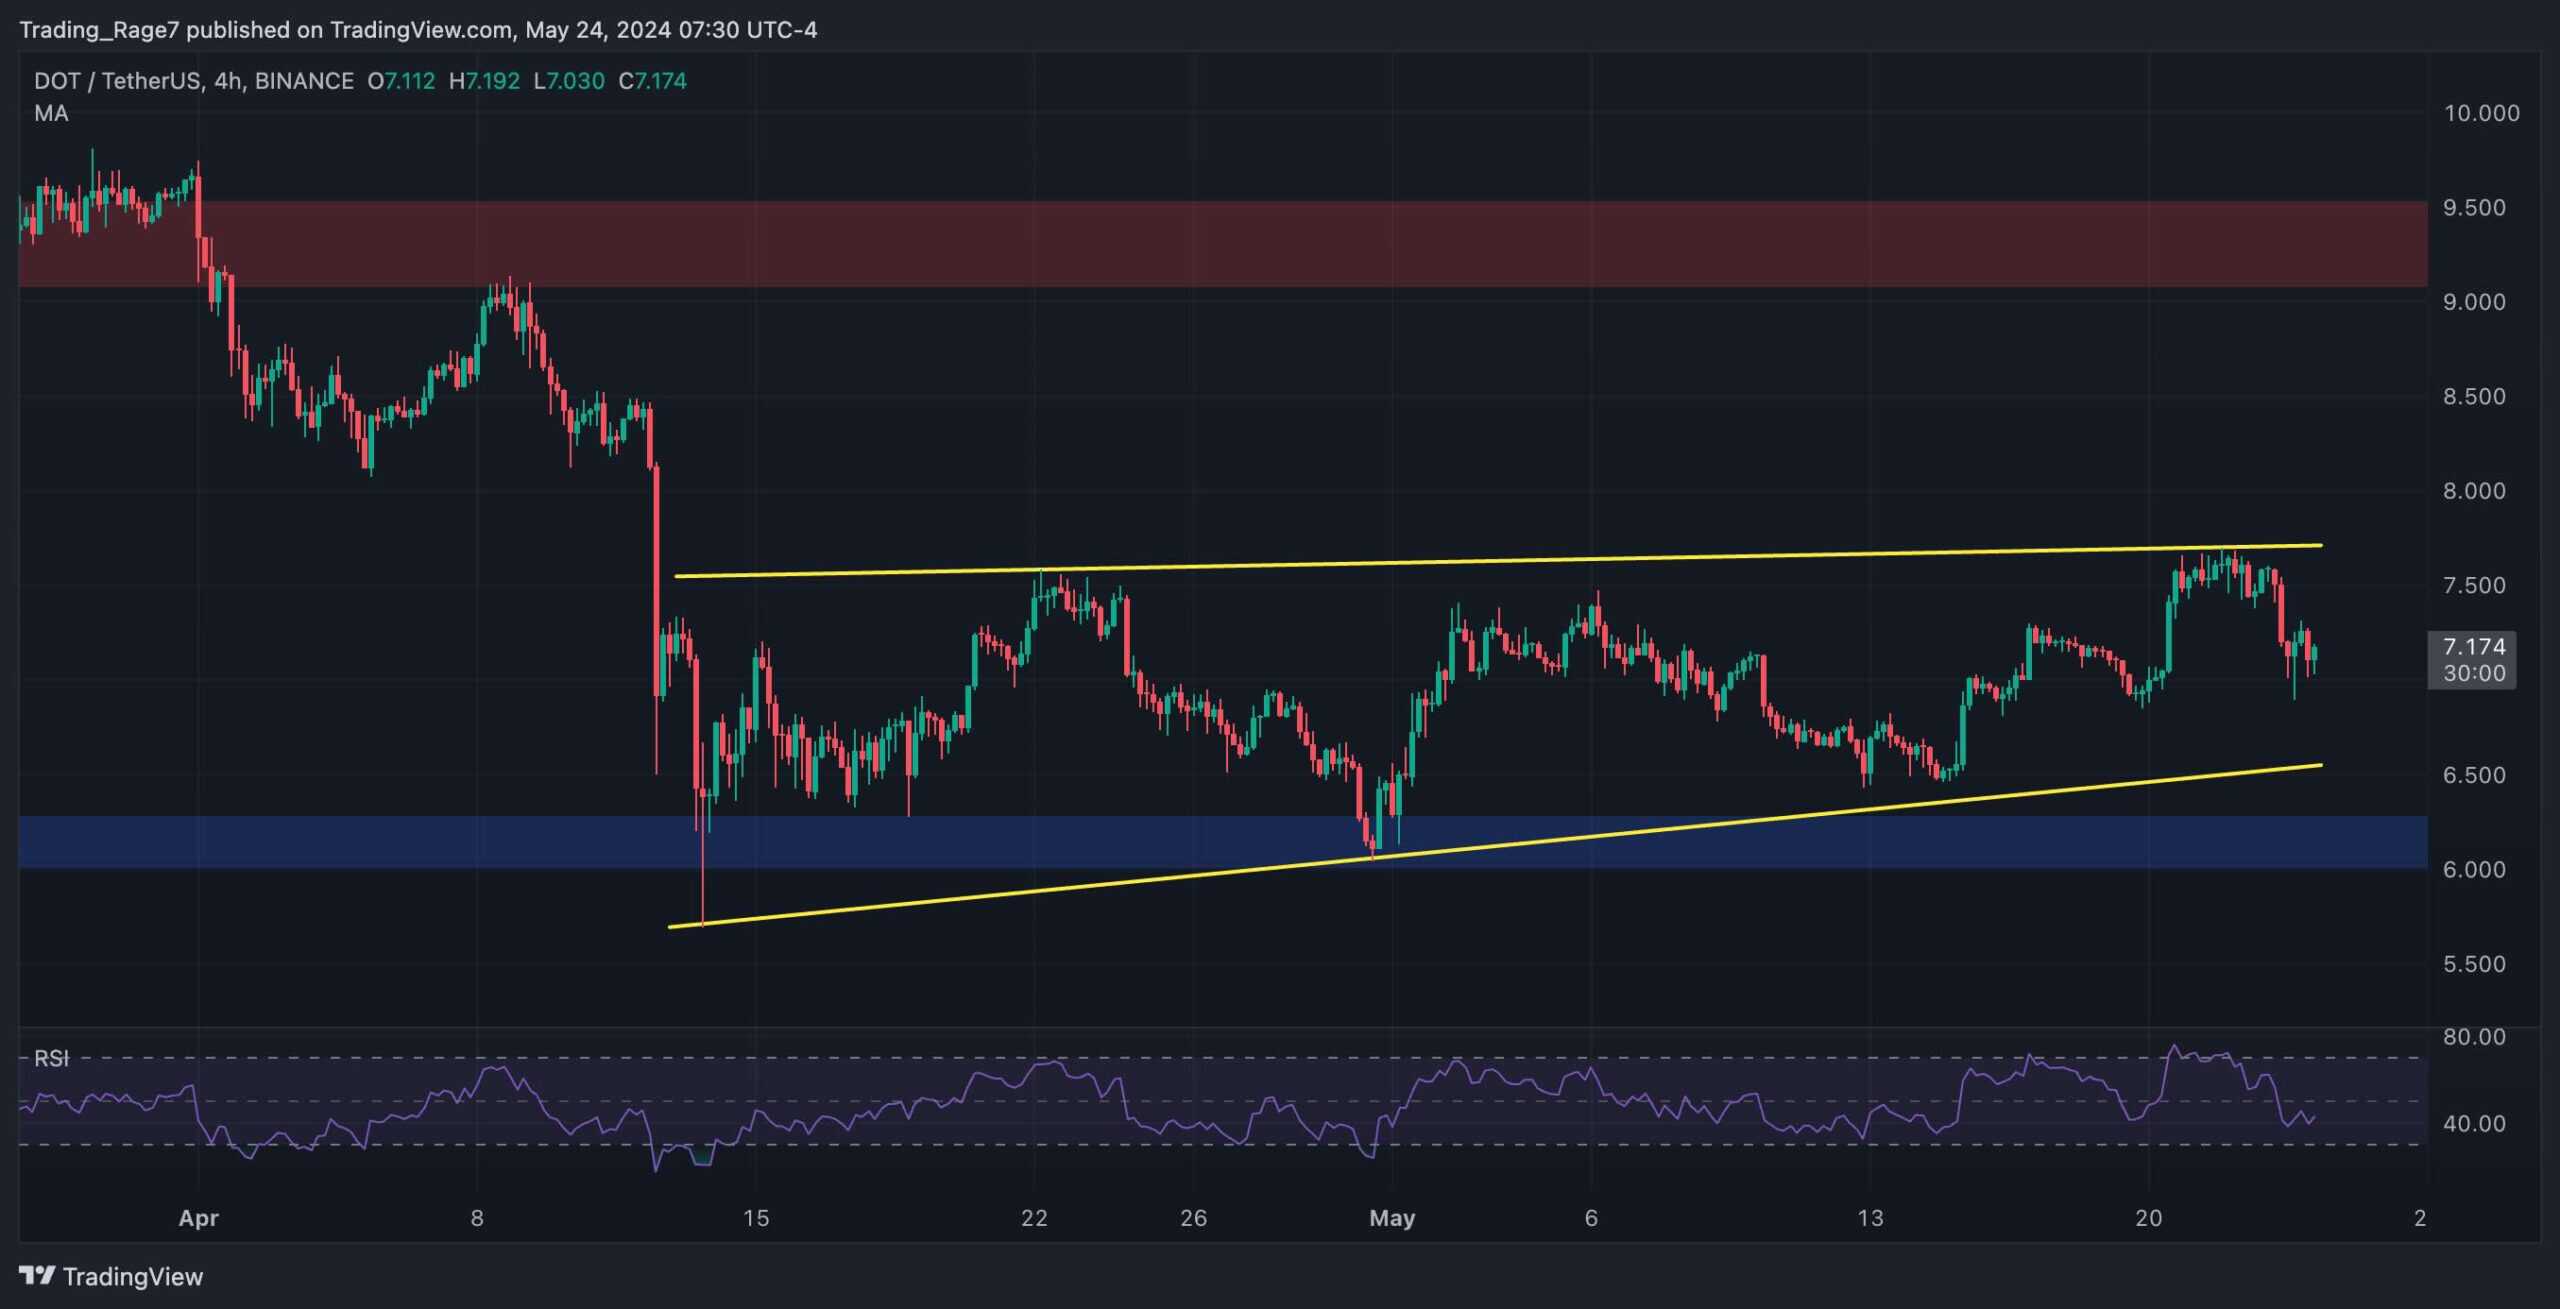
Looking at the 4-hour chart, the recent consolidation inside the large flag pattern becomes more clear. The price has recently been rejected from the higher boundary of the pattern.
With the RSI dropping below the 50% mark, the momentum on the 4-hour time frame has shifted bearish. Therefore, a retest of the lower trendline seems possible in the short term.

Futures Market Analysis
By TradingRage
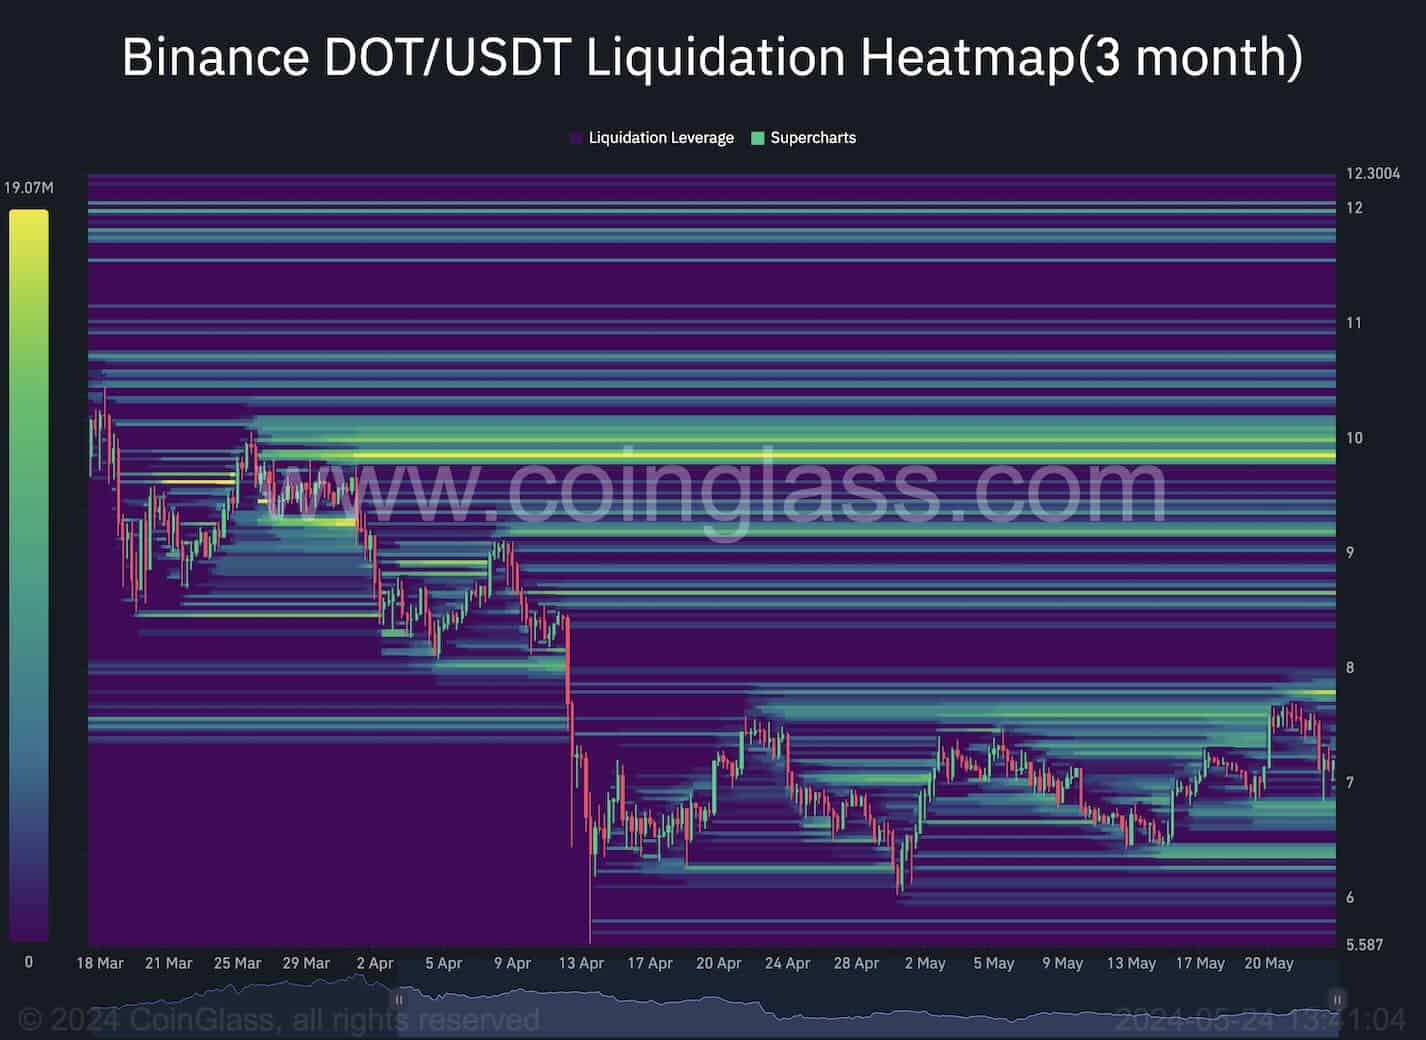
Polkadot Binance Liquidation Heatmap
While the Polkadot price has been undergoing a long consolidation, analyzing the futures market metrics can yield valuable information. This chart presents the DOT/USDT Binance liquidation heatmap, which visualizes the prominent liquidity pools that could attract the price.
The chart shows that the $6.5 and $8 levels contain the most liquidity close to the current price. Therefore, a breakout from either level can result in a liquidation cascade and aggravate the move. Meanwhile, the most liquidity currently resides at the $10 level. Therefore, it is arguably the most essential zone if the price begins to move higher.

 cryptopotato.com