
$NEAR faces critical resistance at 0.00012274 $BTC, with analyst Michaël van de Poppe noting potential gains to 25,000 sats amid current market momentum.
$NEAR is presently facing a critical resistance level, setting the stage for a possible breakout that could yield substantial gains. With the cryptocurrency market showing signs of renewed momentum, $NEAR is among the altcoins that have been trending upward, drawing the attention of investors and analysts alike.
Notably, market veteran Michaël van de Poppe has noted that if the market momentum continues, $NEAR could break out to 25,000 sats, essentially the 0.00025 $BTC level.
$NEAR Resistance at 0.00012274 $BTC
As of now, the price of $NEAR/$BTC is approximately 0.00011521 $BTC. According to van de Poppe’s chart, the cryptocurrency, marked by a pronounced downward trend, slumped from its peak against Bitcoin in early 2022 to a bottom in late 2023.
However, since the beginning of 2024, $NEAR has shown signs of recovery, consolidating and moving upward. This upward movement has brought $NEAR to a resistance level of around 0.00012274 $BTC, a critical point that it has tested but not yet surpassed.
Is a Breakout Possible?
Should $NEAR overcome the 0.00012274 barrier, the next major resistance zone lies between 0.00025800 and 0.00025840 $BTC. This zone represents a significant target, as breaking through could lead to a price increase of approximately 103.29% from the current level.
On the downside, Poppe’s chart reveals that $NEAR has immediate support around its current price. This support is reinforced by the consolidation zone below 0.00010000 $BTC, which has historically provided a strong foundation during periods of price decline. If $NEAR fails to break through the resistance and instead falls below the current support, it may retest these lower support levels.
On the other hand, the Relative Strength Index in Poppe’s chart is moving horizontally, indicating that $NEAR is currently in a consolidation phase. However, the RSI is approaching the overbought region (>70), suggesting a potential price correction in the near future.
$NEAR/$BTC Shows Steady Bullish Signals
The MACD indicator is also moving horizontally at 0.00001356 above the zero line, signaling a slow but steady bullish trajectory for the $NEAR/$BTC pair. The MACD histogram supports this trend, with bars consistently above the zero line.
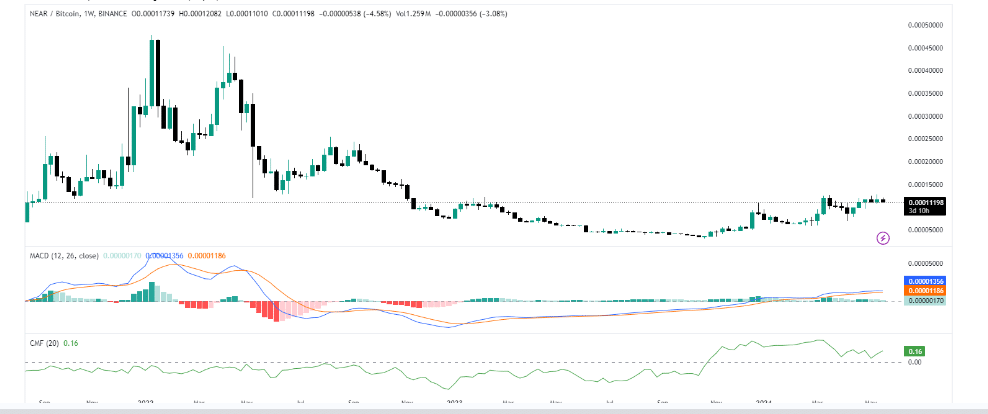
Similarly, the Chaikin Money Index trends vertically, indicating increased money inflow into the $NEAR/$BTC pair and suggesting a strengthening bullish sentiment.