
Avalanche ($AVAX) has been experiencing a significant upswing over the past 24 hours, with support established at $35.74. The bullish trend propelled $AVAX’s price to a 30-day high of $41.06 before it encountered resistance. At the time of writing, $AVAX is trading at $40.65, marking a surge of 12.43% from its intra-day low.
$AVAX/USD 24-hour price chart (source: CoinMarketCap)
During this rally, the market capitalization and 24-hour trading volume of $AVAX increased by 12.44% and 138.78%, respectively, to $15.56 billion and $828.9 million.
Market Influences and the Ethereum Connection
The recent rally in $AVAX can be partly attributed to the broader market optimism spurred by significant developments in the Ethereum ecosystem. Notably, crypto analyst KALEO hinted at a potential bullish season for Ethereum Virtual Machine (EVM) compatible Layer 1 (L1) solutions, triggered by news of a potential approval for a spot Ethereum ETF.
$AVAX
— K A L E O (@CryptoKaleo) May 21, 2024
I wouldn't be surprised if this ETH news ushers in an EVM season for L1s.
Continue sending $AVAX higher with haste. https://t.co/brAWLvGGNN pic.twitter.com/8hKn0RkDCT
This news has injected a wave of optimism across the crypto market, influencing altcoins like Avalanche. As Ethereum’s price targets a potential rally to $4,000 following positive ETF news, $AVAX and similar platforms are also experiencing enhanced investor confidence. Moreover, with Bitcoin sustaining its bull rally by recording a monthly high above $71k, the market sentiment is bullish.
$AVAX/USD Technical Analysis
Technical indicators for Avalanche show promising signs of continued growth on the 4-hour price chart. The 50-day and 200-day Exponential Moving Averages (EMAs) are forming a golden cross on the 4 hour price chart, which is traditionally seen as a bullish indicator. This trend suggests that the $AVAX price trend is nearing a breakout to the upside.
Moreover, the Moving Average Convergence Divergence (MACD) remains in a positive trajectory despite its position in negative territory, suggesting that there might be sustained buying pressure if the market conditions remain favorable. The developing higher highs on the histogram additionally point to a continuation of the bull rally.
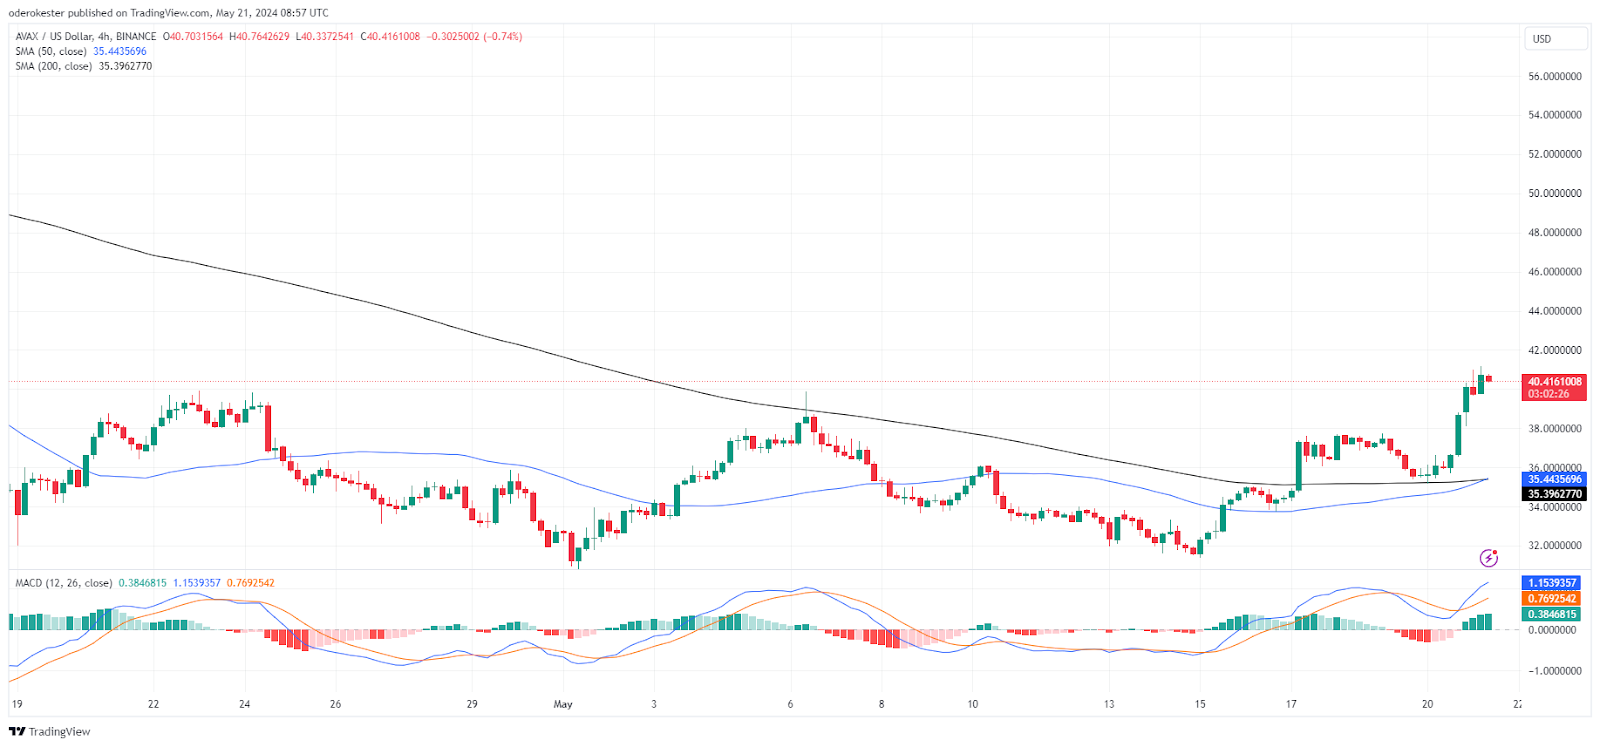
MACD/USD 4-hour price chart (source: TradingView)
On the AVAXUSD 24-hour price chart, the Relative Strength Index (RSI) has recently moved above the 50 mark, which typically indicates a bullish momentum. This movement, coupled with increasing trading volumes, suggests that the price could stabilize and push past the recent resistance level.
Market analysts are watching the $45 and $50 mark as the next significant resistance levels, with support levels solidifying around $35 and $32.
With the Chaikin Money Flow (CMF) moving in the positive region with a rating of 0.04, bullish momentum may be waning. This CMF trend suggests that the buying pressure is winding down, which is seen as a bearish grip looming.
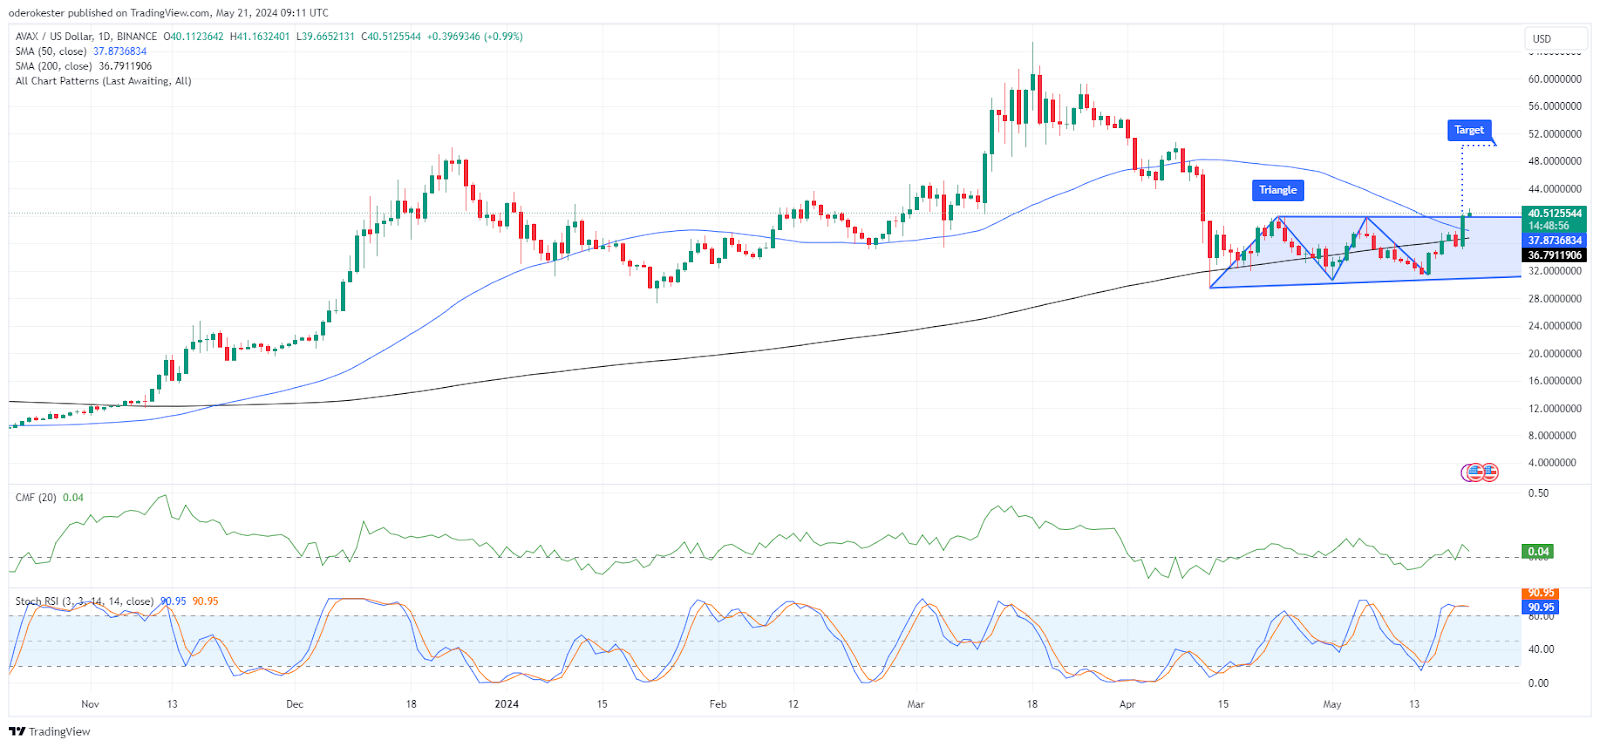
$AVAX/USD 24-hour price chart (source: TradingView)
If the CMF falls below the zero line, a bearish shift may be anticipated. Moreover, the 50-day MA (blue) is moving southwards, nearly falling below the 200-day MA (black), supporting the decreasing bullish strength.
In addition, the stochastic RSI motion in the overbought region, with a reading of 90.95, suggests that the bull rally is exhausted. This trend, as a result, cautions investors of a potential pullback, necessitating the need to set stop losses if the trend continues.
Disclaimer: The information presented in this article is for informational and educational purposes only. The article does not constitute financial advice or advice of any kind. Coin Edition is not responsible for any losses incurred as a result of the utilization of content, products, or services mentioned. Readers are advised to exercise caution before taking any action related to the company.