Polkadot’s price action has been choppy lately, with the market going through a consolidation period over the last month. However, things might be turning for the better.
Technical Analysis
By TradingRage
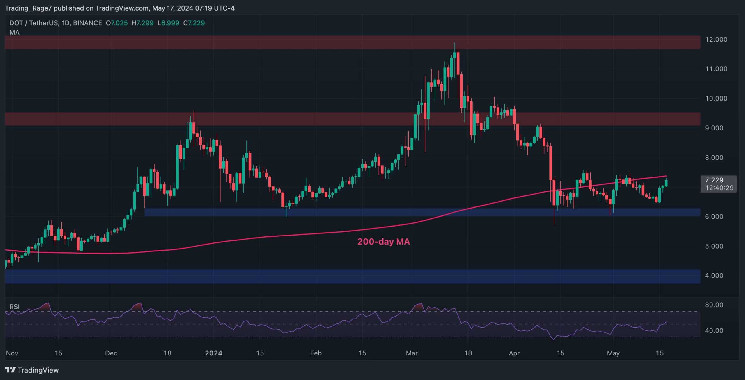
The Daily Chart
In the daily timeframe, it is evident that $DOT’s price has been hovering below the 200-day moving average, at around the $7.5 mark, for a while now. Yet, the cryptocurrency is approaching the moving average again, looking to break above.
Since the $6 support level has held the price several times, a bullish breakout above the moving average seems more likely than a bearish continuation. Therefore, a climb above the 200-day moving average and toward $9 is a probable scenario in the short term.
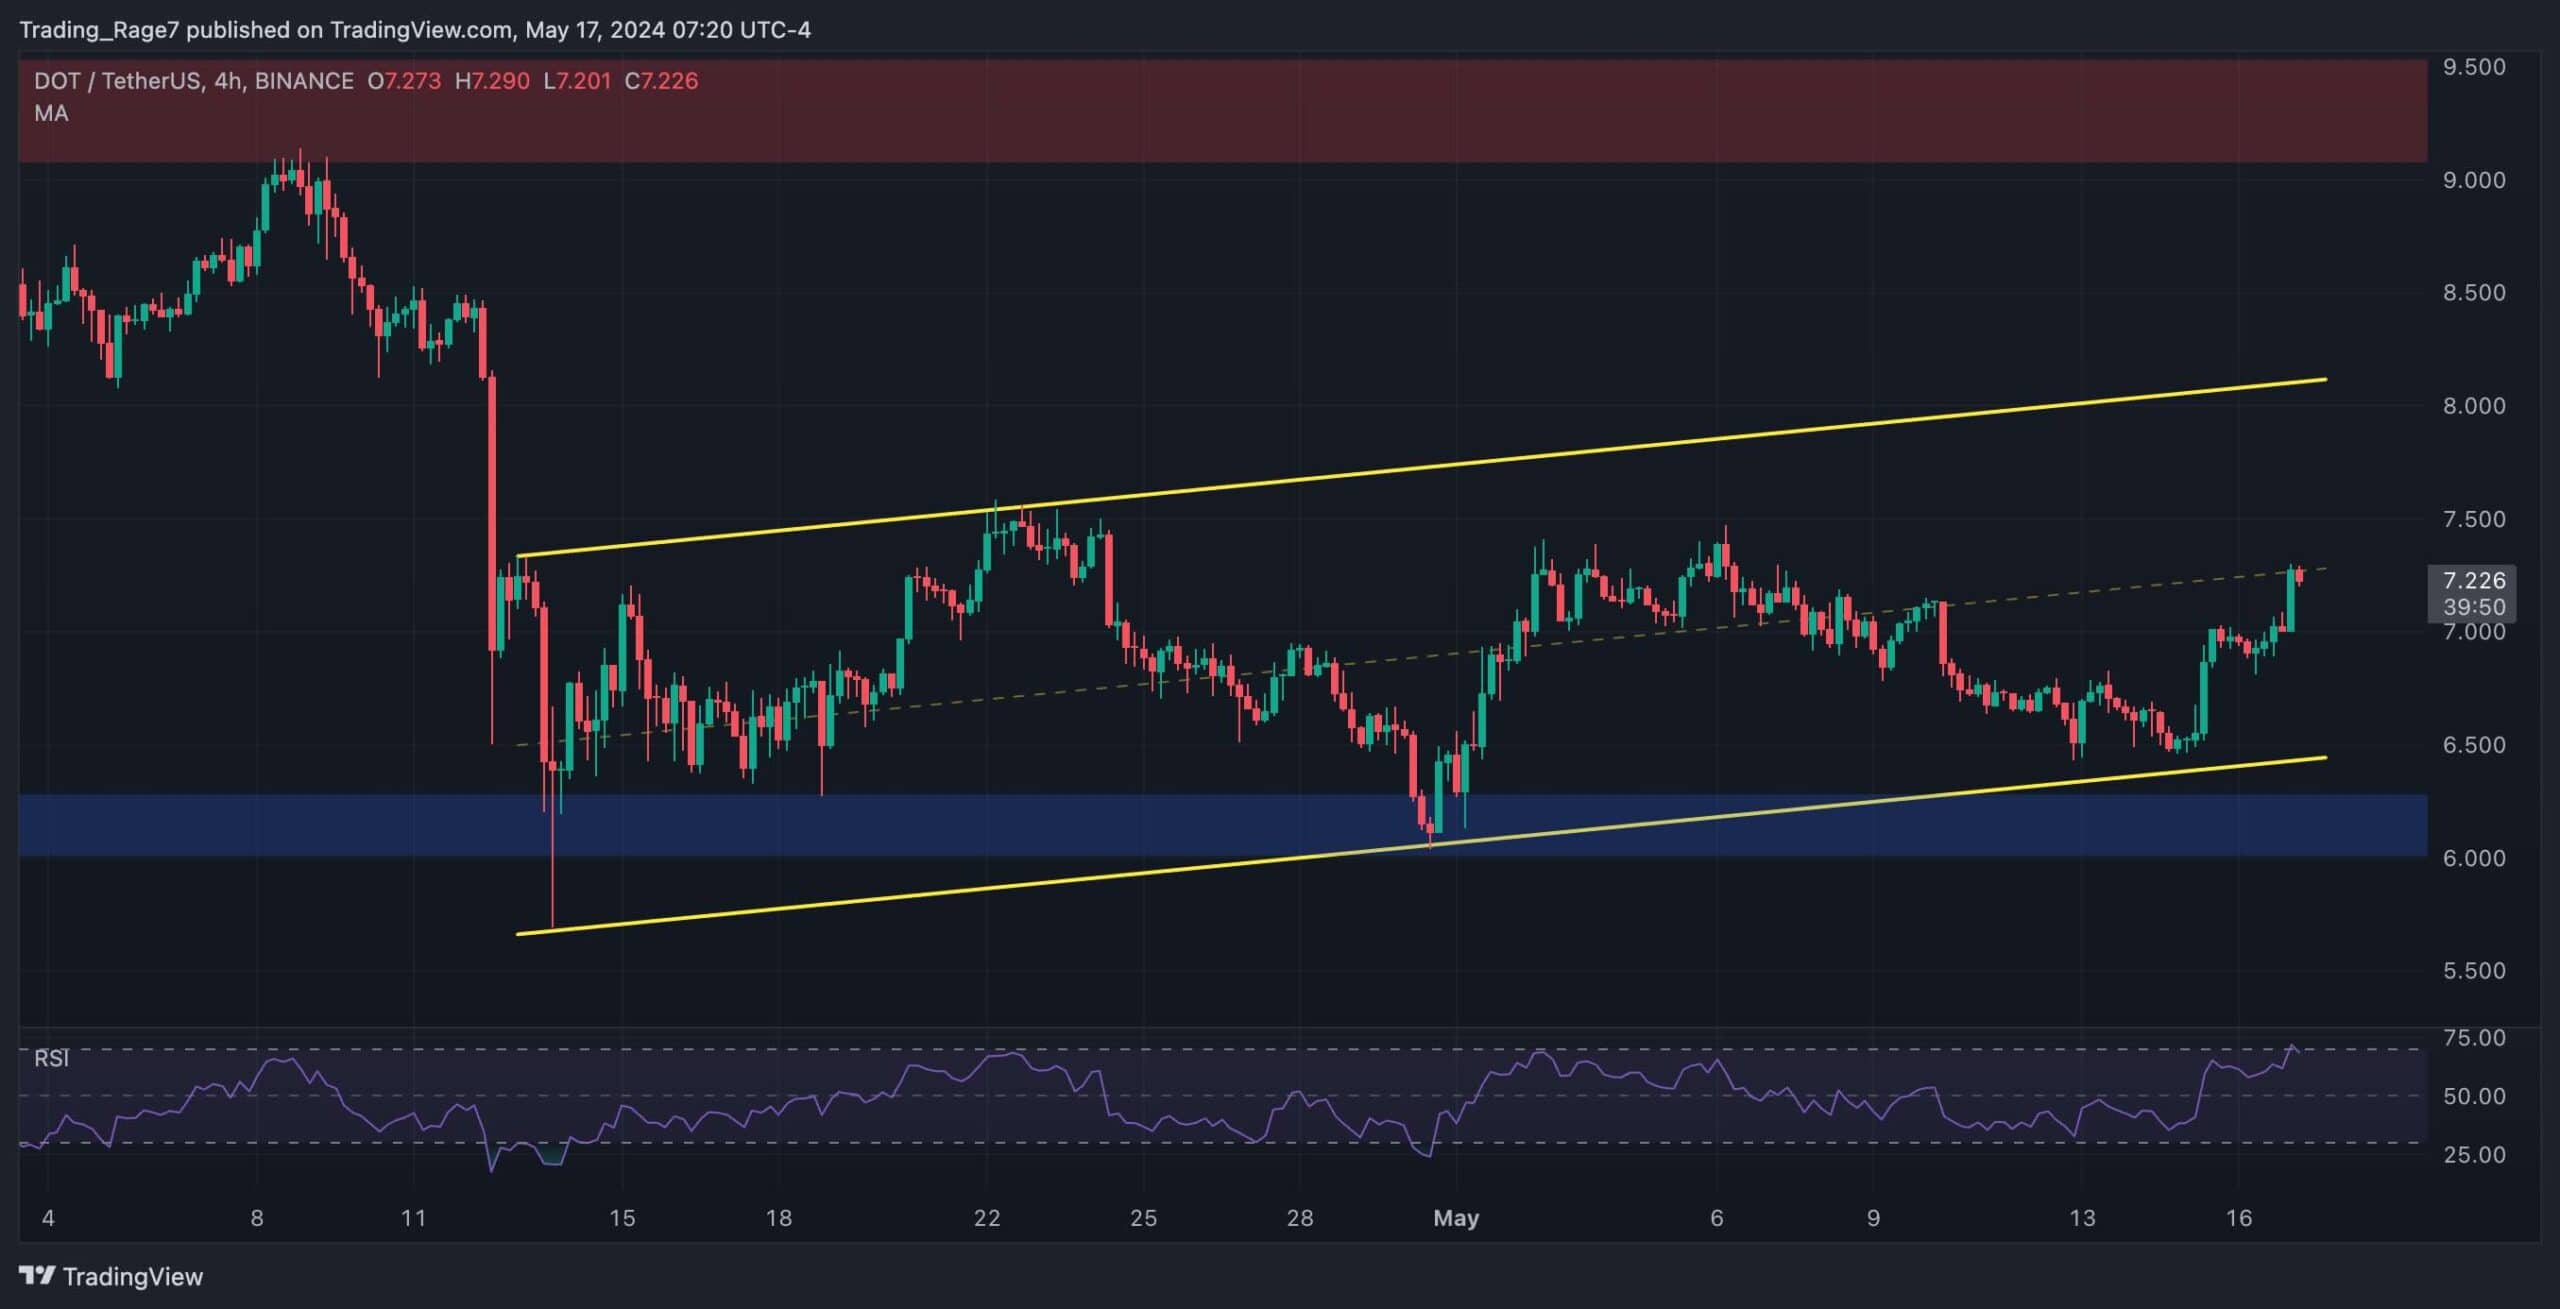
The 4-Hour Chart
The 4-hour timeframe clearly shows the recent price action. The market has been gradually rising in a large ascending channel. Following a rebound from the lower boundary, Polkadot tested the channel’s midline.
A rally toward the higher boundary and the $8 price mark could be expected if a breakout occurs. Yet, investors should be wary of the Relative Strength Index reaching the overbought region, as short-term correction could also take place.
Futures Market Analysis
By TradingRage
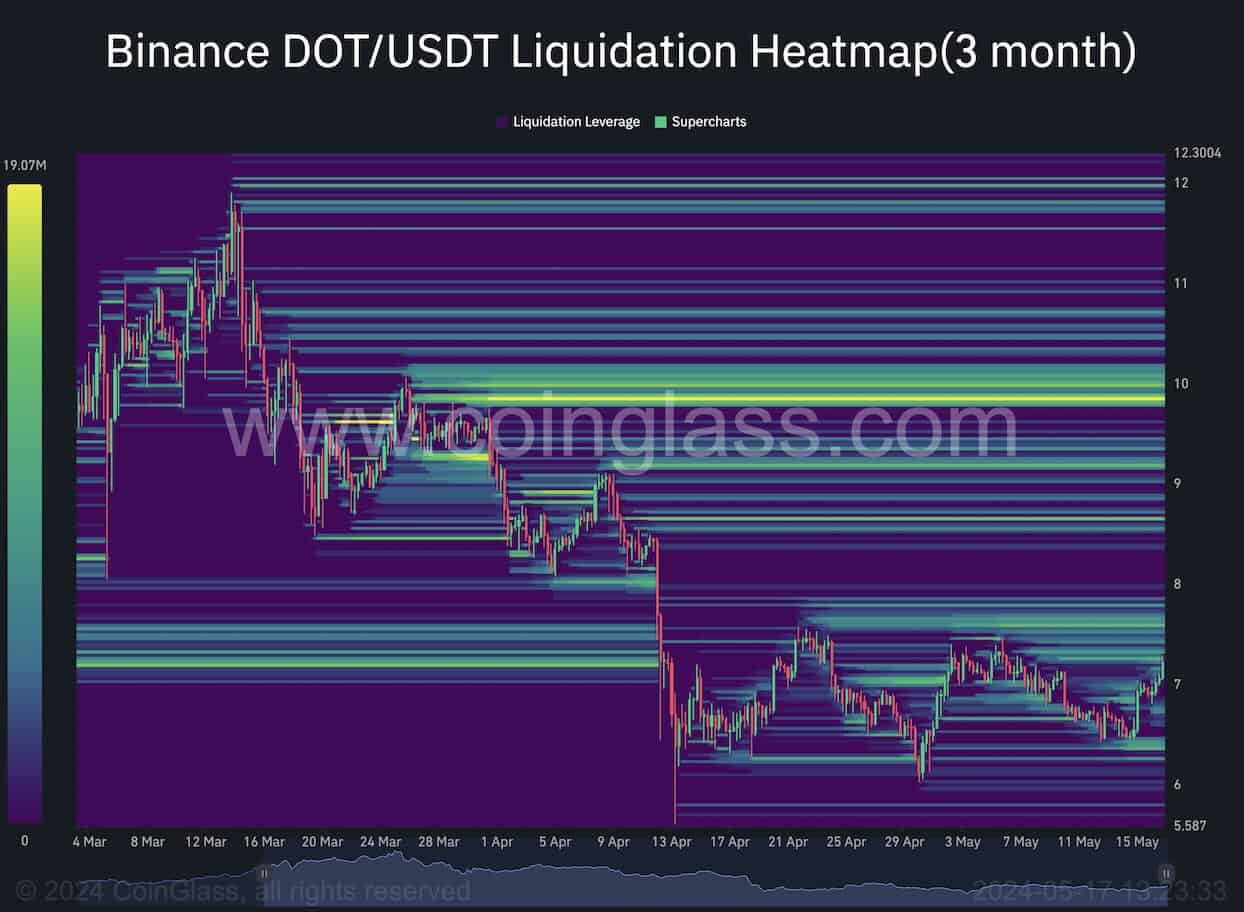
Polkadot Binance Liquidation Heatmap
Analyzing the futures market could deliver valuable insights about key levels to watch, with the $DOT price seemingly finding a bottom. This chart shows the Binance $DOT/USDT perpetual pair’s liquidation heatmap. It indicates where the most liquidity resides.
A considerable amount of liquidity is found above the recent high of $7.5. Therefore, it could be a target for the market to clear in the short term. Consequently, an increase above this area could lead to a short-liquidation cascade that would probably push the price toward the $9 region.