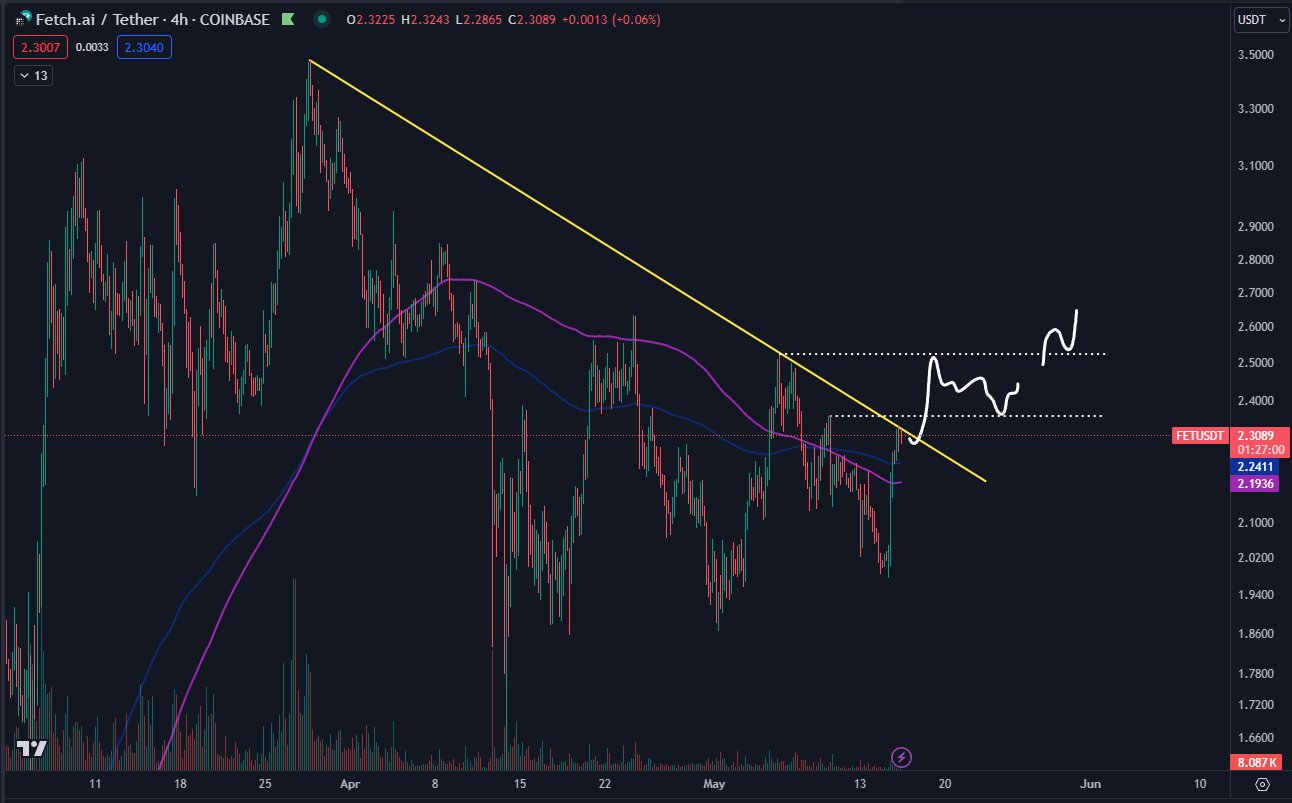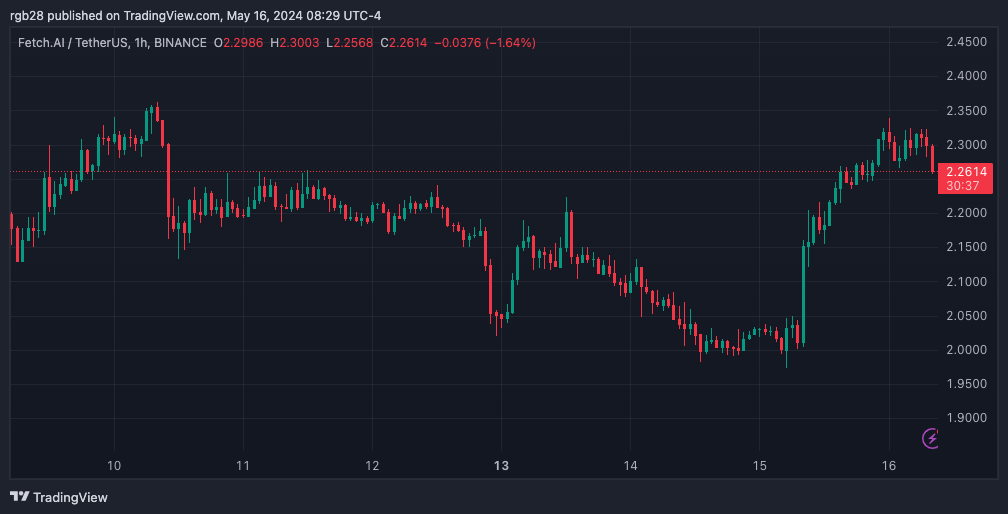
A breakout above this level could be a “good start to a further trend change.” Moreover, the token broke “above the 4H 200MA/EMA already.” Per the trader, $FET would need to test the $2.5 mark and remain above the $2.35 price range to “break the trend and head higher over the next couple of weeks.”
Similarly, crypto trader Scient considers the token consolidating inside a one-day ascending bullish triangle. His chart highlights the $2.12 mark as support for the diagonal trendline.
He forecasted a deviation below the trendline “towards 1D 100EMA” before reclaiming the $2.12 price range and moving back inside the triangle. If a retest and confirmation of the trendline reclaim occurred, the trader suggested he “would long it.”
Analysts Forecast $4 For $FET
Crypto analyst World of Charts identified a “textbook” bullish pennant pattern on $FET’s chart. The analyst expects an upside breakout soon, potentially leading to a 2x bullish wave. If the breakout is successful, the token’s price could move above the $4 price range.
$Fet
Formed Text Book Bullish Pennant Expecting Upside Breakout Soon Expecting 2x Bullish Wave Incase Of Successful Breakout #Crypto #Fet #Fetchai pic.twitter.com/Y3c0pqNFgN
— World Of Charts (@WorldOfCharts1) May 15, 2024
Moreover, CryptoBoss seems to concur with this forecast. The trader shared a similar chart, signaling a possible breakout that could drive the token to double its price. In the post, he stated, “$FET 4$ exe loading…”

 newsbtc.com
