
 u.today
Shiba Inu is approaching key resistance levels that could determine its next price movement. The 26-day EMA, followed by the 50-day EMA, are the main targets for $SHIB's price in the foreseeable future.
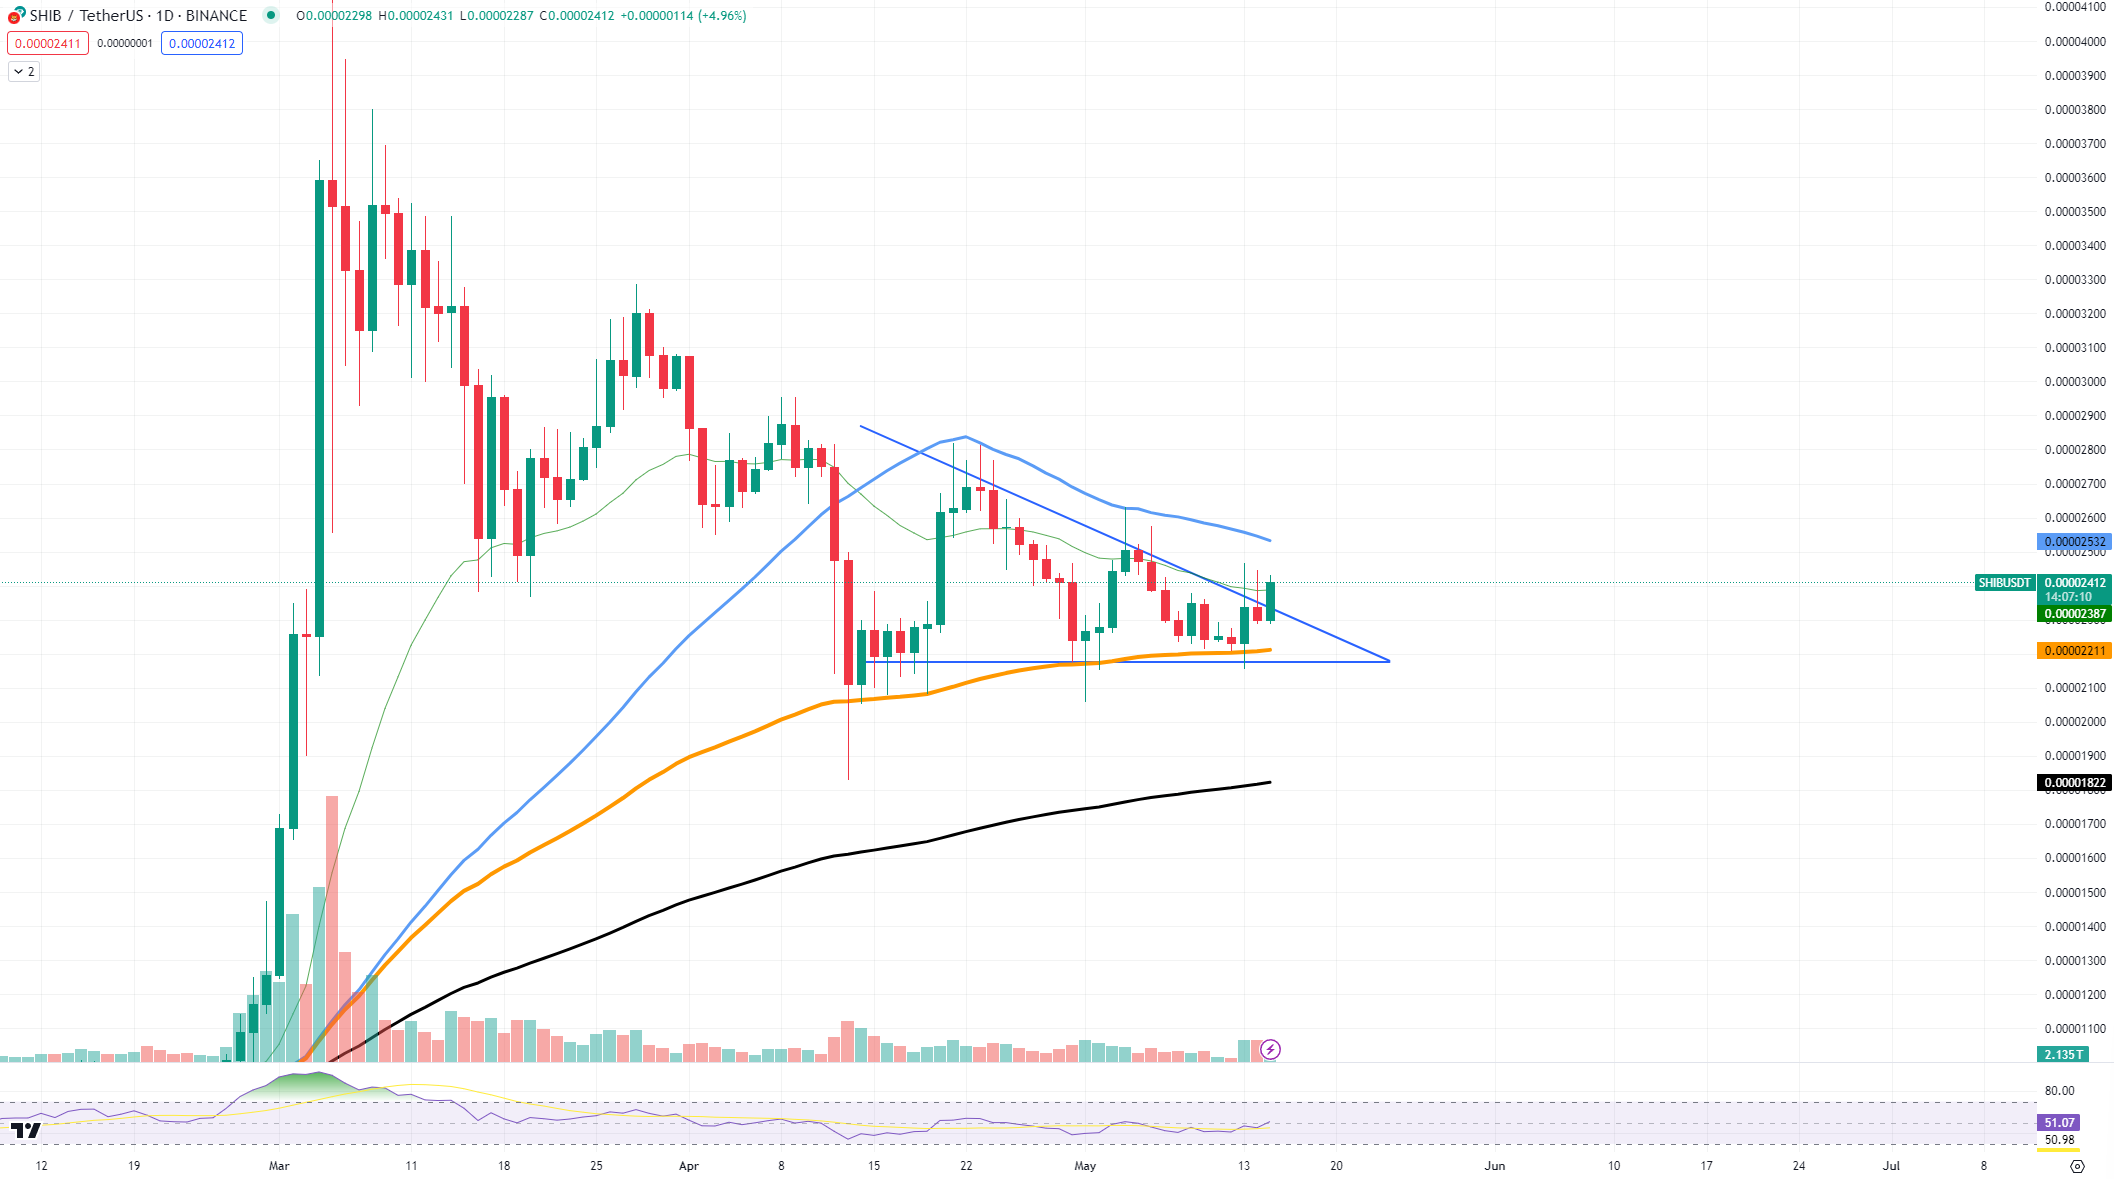
$SHIB is currently trading around $0.00002379. The price has been consolidating within a descending triangle. However, recent price action suggests a breakout. The 26-day EMA, around $0.00002385, is the first resistance level for $SHIB. If it manages to break this level, the next target would be the 50-day EMA, currently at approximately $0.00002527.
Volume analysis shows increased trading activity, with significant buying pressure observed during recent dips. This suggests that investors are accumulating $SHIB at lower prices, which could support a potential breakout. The Relative Strength Index is around 45, indicating that $SHIB is neither overbought nor oversold, showing room for upward movement.
Examining on-chain metrics, the number of large transactions and their volume offer additional insights. Over the past month, there has been a notable increase in large transactions, peaking at 280 transactions on May 13. The volume of these transactions reached a high of 9.6 trillion $SHIB on the same day, highlighting substantial whale activity.
The charts reveal that in the last 24 hours, 206 large transactions totaling 3.88 trillion $SHIB were recorded. This high volume of transactions is a positive sign, indicating strong interest and engagement from large holders. If this trend continues, it could provide the necessary momentum for a breakthrough in $SHIB’s price.
Considering current market conditions and on-chain data, there is a strong possibility that $SHIB could experience a breakout in the next 24 hours. The key levels to watch are the 26-day and 50-day EMAs. If $SHIB manages to close above these resistance levels with substantial volume, it could signal a trend reversal and initiate new upward movement.