Egrag Crypto sees the XRP “Launching Channel” as a bullish sign, predicting a potential rise to $6.4 with key indicators suggesting strong accumulation.
Egrag Crypto’s latest analysis spotlights a trading pattern he calls the “Launching Channel” in XRP’s chart, suggesting bullish strength. This pattern is identified by partial wicking candles and ascending consolidation. According to Egrag, the setup represents a steady accumulation, poised for a breakout.
The analyst posits that maintaining this channel on a weekly timeframe could signal the commencement of an “Ignition stage,” potentially elevating XRP’s price to a major target of $6.4, a 1260% rise from its current price.
#XRP Launching Channel:#XRP is holding strong LIKE A BOSS🦾. The Launching Channel features partial wicking candles, with the top end showing an ascending consolidation, indicating #Bullish strength.
I'll start worrying if we lose the Launching Channel on the weekly… pic.twitter.com/sLcGhRM0qN
— EGRAG CRYPTO (@egragcrypto) May 13, 2024
Egrag however expresses cautious optimism, noting that any break below this channel on the weekly chart would be a cause for concern and could indicate a reversal of the bullish trend.
The analyst’s chart also identifies several significant price points and the market’s reaction at these levels through Fibonacci retracement. Crucial levels include 0.236 at $0.45193, 0.382 at $0.59865, 0.5 at $0.75138, 0.618 at $0.94306, 0.786 at $1.30324, and the 1.272 extension level at $3.32217.
The highest price point in the past data, around $1.96778, serves as a crucial historical resistance level. These Fibonacci levels offer a roadmap for traders, indicating where buying or selling pressure might intensify, potentially leading to price pivots or trend continuation.
XRP Indicators and Current Market Behavior
Notably, XRP is trading at $0.5057, experiencing a minor decline of 0.11% in the last 24 hours. Over the past week, it has seen a 5.82% decrease in value. Despite these fluctuations, XRP maintains a strong market capitalization of $27.95 billion.
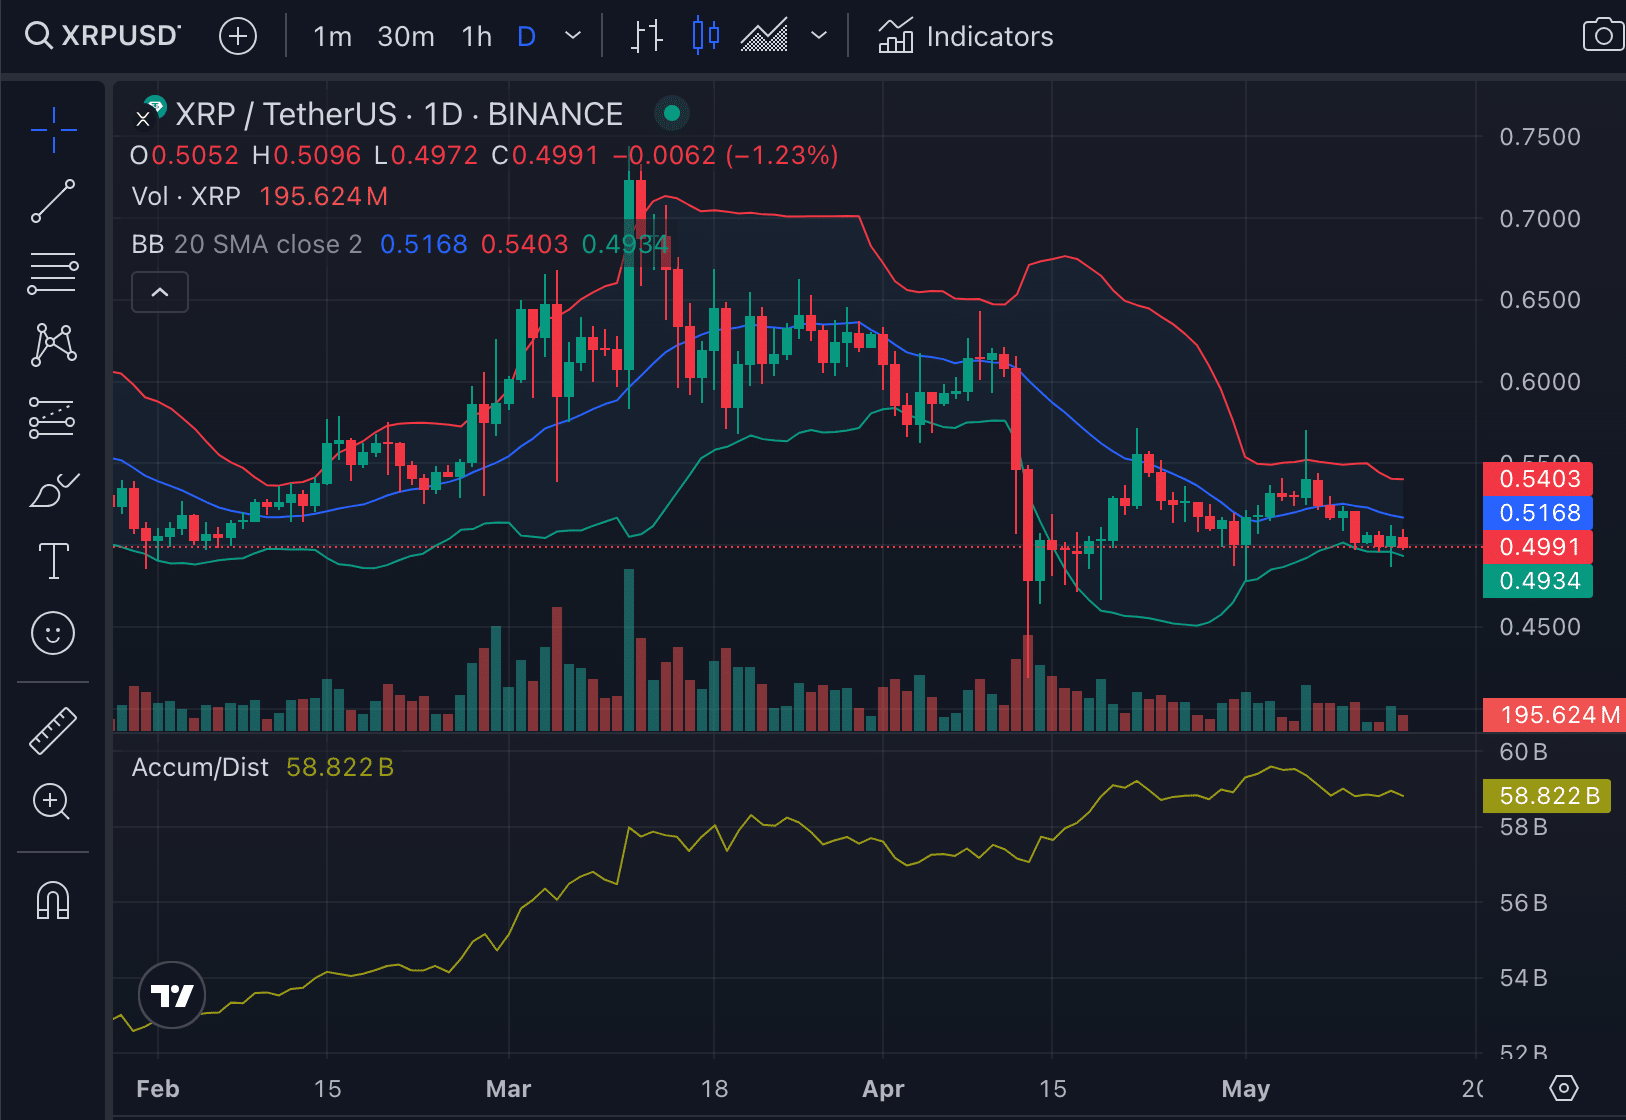
Indicators, such as the Accumulation/Distribution (Accum/Dist) line and Bollinger Bands, have also provided deeper insights into XRP’s market dynamics. The Accum/Dist line, currently at 59.011 billion, helps assess whether capital is flowing into or out of XRP by comparing volume with price movements.
The daily chart analysis below shows the Accum/Dist line as rising, which can be interpreted as a sign of accumulation. This suggests that more traders are buying XRP than selling it, and such buying pressure could potentially lead to an upward price movement if it continues.

Meanwhile, looking at the Bollinger Band indicator, XRP’s price is positioned slightly below the middle band, suggesting that it is trading in the lower segment of its recent price range. This positioning indicates a potentially undervalued state, which could be considered a buying opportunity for investors.
Other Analysts Concur
Donovan Jolley, another market watcher, has contributed his perspective on XRP’s potential. He suggests that the current market indicators and historical price movements are setting the stage for a notable uptrend.
OG #Altcoins are waking up and following perfectly with the all time #Altcoin total market cap 💰
This is a fractal showing this is our #SuperCycle 📈#XRP is also following the EXACT same accumulation it did before 2017 👀
This rocket is about to TAKE OFF 🔥🚀#XRPCommunity pic.twitter.com/oJZzG6hGmA
— Donovan Jolley (D.I.Y Investing) (@vajolleratzii) May 10, 2024
Jolley points to the alignment of technical signals with market sentiment, which, in his view, indicates an impending price increase.
Armando Pantoja offers a specific price prediction, foreseeing a rebound for XRP to $1.98. His forecast is based on a recent surge in transaction volumes on the XRP network, which he identifies as a critical indicator of future price movements.
Pantoja cites data from Santiment, which shows that increases in transaction volumes often precede upward price trends. This correlation suggests that the heightened activity could lead to a substantial price rally.
Moreover, analyst U-copy provides a long-term technical analysis, indicating that XRP is approaching a critical juncture after a seven-year symmetrical triangle formation. This analyst highlights the accumulation phases from 2013 to 2017 and again from 2018 to 2024, suggesting that these periods of price stabilization are likely precursors to a significant breakout.
 thecryptobasic.com