- Helium price analysis is bullish today.
- The next resistance for HNT/USD is present at $35.
- Strong support is present at $31.
The Helium price analysis is bullish for today as the bullish momentum had inflated the price level to $33.5, which is also the resistance level set by bears on 4th December when the market observed a heavy sell-off. Today bulls have covered a good upwards range, and the price swang as high as 34.5 at a moment. The recent bullish momentum started when HNT found the support floor around the $25 range. Prior to this, HNT was on the decline after the price touched the all-time high at $52.7 on 14th November, but now the trend has changed, and the recent short-term trend line is upwards.
HNT/USD 1-day price chart: Helium recover to $33.5
The 1-day price chart for Helium price analysis shows the coin traded in a range of $31.6 to $34.5. The crypto pair is trading hands at $33.5 at the time of writing. The cryptocurrency also reports an increase in price value by 1.5 percent over the last 24 hours and also reports an increase in value by more than 12 percent over the past week. Trading volume has increased by 2.96 percent, and the market cap has increased by 3.61 percent over the last 24 hours.
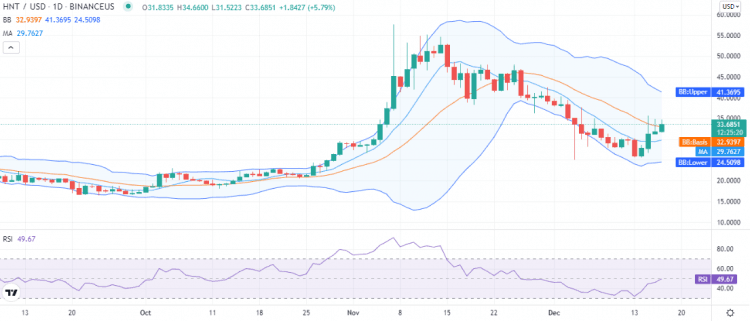
The volatility has decreased to a degree but is still high. The Bollinger bands average is now at $32.9, representing support for HNT. Whereas the upper Bollinger band value is at $41, representing resistance, and the lower Bollinger band value is at the $24.5 level. The Relative Strength Index (RSI) score has improved up to index 49 and is still maintaining its upward curve, hinting at the buying activity in the market.
Helium price analysis: Recent developments and further technical indications
The 4-hour Helium price analysis shows the price oscillated fast upwards at the start of the trading session but faced rejection at $34.2, and bears pulled the price down to $32.4. Even a swing down to $31.4 was also observed at a moment. But coin rejected further downside as bullish efforts started again, and the price was raised back to the current price level.
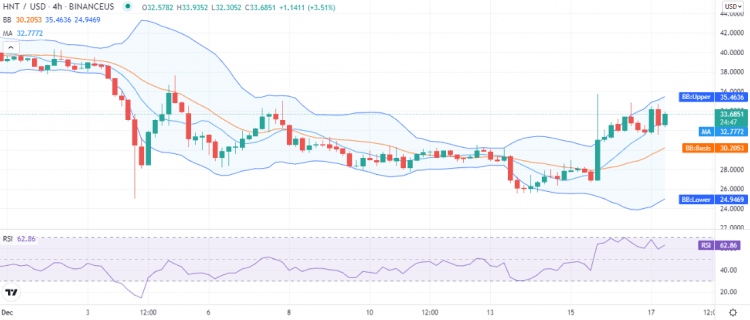
The Bollinger bands indicator shows the following values in the four hours price chart; the upper value is $35.4 representing resistance for HNT, whereas the lower value is $24.9. The RSI has reached near the overbought region as the indicator is trading at index 62. RSI took a downturn during the previous four hours but has again turned upwards as the buying started again. The MA is also trading below the price level at the $32.7 mark.
Helium price analysis: Conclusion
The Helium price analysis shows the trend has changed as the continuous bullish momentum helped in obtaining a short-term upward trend line which may continue in the future as well. The price is rising again, but strong resistance was observed above the $34 level, so we expect HNT to correct again for a few hours before breaking above the $34.5 resistance later today or in the next trading session.
Disclaimer. The information provided is not trading advice. Cryptopolitan.com holds no liability for any investments made based on the information provided on this page. We strongly recommend independent research and/or consultation with a qualified professional before making any investment decisions.