Basic Attention Token, or BAT, is the token that powers a new blockchain-based digital advertising platform designed to fairly reward users for their attention while providing advertisers with a better return on their ad spend.
The Basic Attention Token itself is the unit of reward in this advertising ecosystem and is exchanged between advertisers, publishers, and users. Advertisers pay for their advertising campaigns in BAT tokens. Out of this budget, a small portion is distributed to advertisers, while 70% is distributed to users — whereas the intermediaries that typically drive up advertising costs are cut out of the equation to improve cost-efficiency.
Let us see the technical analysis of BAT.
Past Performance of BAT
The coin is trading at a low price of $1.100 which has come down from $1.74 on November 26. It had rallied over 30% to reach $1.88 for the first time, with its market capitalization rising to $2.74 billion. Its climb appeared in contrast to the cryptocurrency market, which lost nearly $283 billion in the same period. It was possibly because of its comparatively lower positive correlation with the top digital assets. However, the lowest was $0.9901 and the highest was $1.24 during the last week.
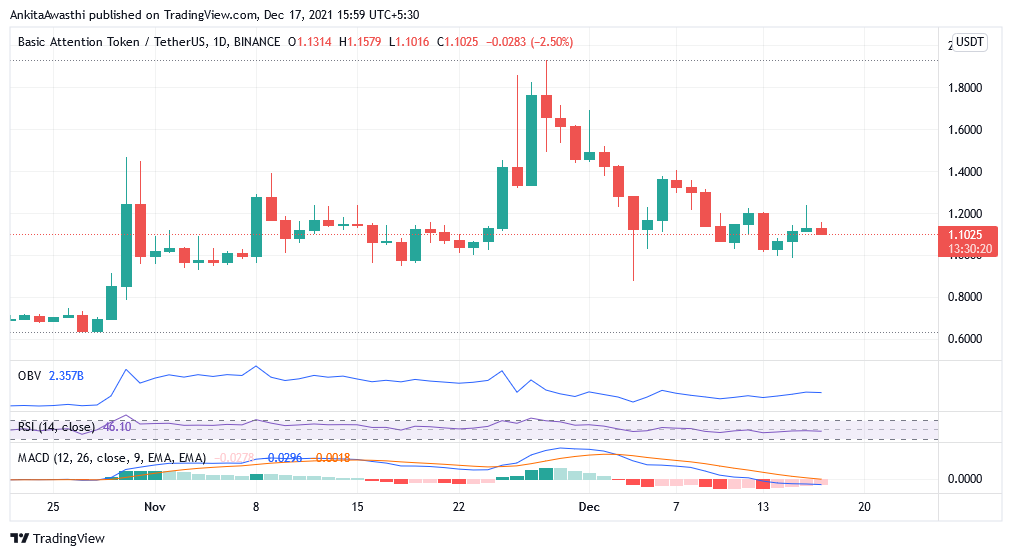
Source: https://www.tradingview.com/x/qTR9lJsL/
BAT Technical Analysis
The $1.50 level has served as resistance to two technical setups developing on BAT charts since April. Thus, we need to reach this critical point as the profit target for BAT’s ascending triangle pattern — confirmed by more than two higher lows and a flat upper trend line — comes to over $2.90 after measuring the structure’s maximum height from its potential breakout point near $1.50.
The On-balance Volume is at 2.4 billion, showing the fall in the direction and low volumes in line with the fall in price.
RSI is at 46%, clearly going in the oversold region where volumes are freely available, thus leaving little incentive to trade.
The MACD lines are separate, and the histogram is forming smaller bars. The slow line is above, showing the current bearish trend will be there.
Price Trends for the Day-Ahead and Tomorrow
The three-day out to 50-day simple and exponential moving averages were giving sell signals, while the 100-day and 200-day, along with the weekly moving averages are bullish. The stochastic RSI was giving a buy signal, while the volume-weighted moving average (VWMA) is bearish. The resistance levels to watch out for are $1.8204 and $2.0560.