- Tron price declined heavily below $0.0200 and $0.0180 against the US Dollar.
- TRX price traded as low as $0.0156 and it is currently correcting above $0.0170.
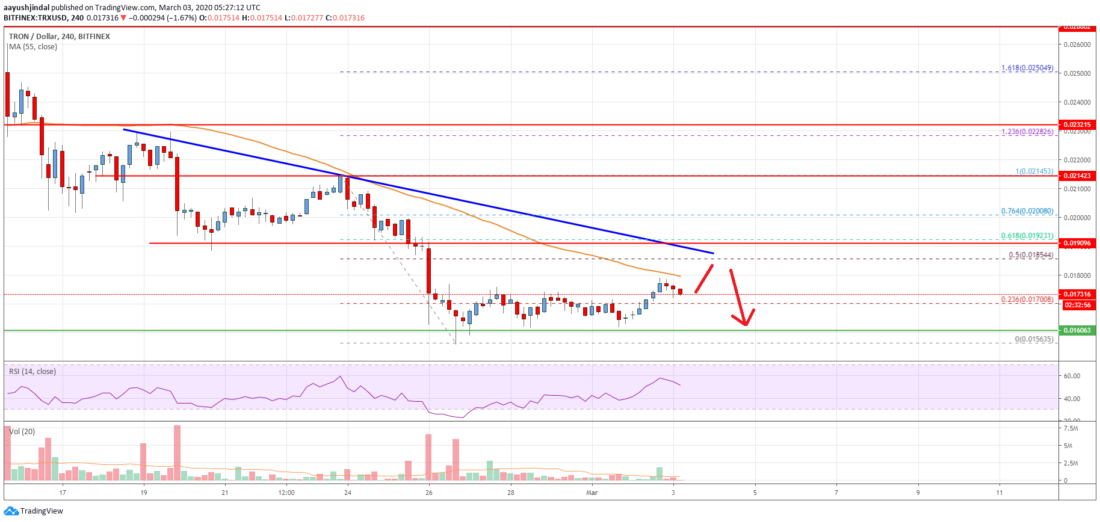
- There is a major bearish trend line forming with resistance near $0.0185 on the 4-hours chart (data feed via Bitfinex).
- The price struggle to clear the $0.0185 and $0.0190 resistance levels in the near term.
TRON price is recovering, but it is facing many hurdles against the US Dollar, similar to bitcoin. TRX price must settle above $0.0190 to start a strong recovery towards $0.0220.
Tron Price Analysis
This past week, we saw a strong decline in TRON price below the $0.0200 support level against the US Dollar. TRX price even broke the key $0.0190 support level and settled below the 55 simple moving average (4-hours) to move into a bearish zone.
Finally, the price spiked below the $0.0160 level and traded as low as $0.0156. It is currently correcting higher and trading above the $0.0170 level. There was a break above the 23.6% Fibonacci retracement level of the downward move from the $0.0214 high to $0.0156 low.
On the upside, an initial resistance is seen near the $0.0180 level and the 55 simple moving average (4-hours). The first major resistance is near the $0.0185 level. It coincides with the 50% Fibonacci retracement level of the downward move from the $0.0214 high to $0.0156 low.
Moreover, there is a major bearish trend line forming with resistance near $0.0185 on the 4-hours chart. Therefore, tron price must surpass the $0.0185 and $0.0190 resistance levels to start a strong recovery in the near term.
The next major hurdles are seen near the $0.0200 and $0.0205 levels. Any further gains could lead the price towards the $0.0220 level.
Conversely, the price might fail to continue above the $0.0185 and $0.0190 resistance levels. In the mentioned case, the price is likely to resume its decline below the $0.0170 level. The next major support is near the $0.0155 level, below which there is a risk of a sharp decline below $0.0150.
Tron Price
The chart indicates that TRX price is clearly correcting higher above $0.0170. Still, there are many key hurdles near the $0.0185 and $0.0190, above which the trend could change from bearish to bullish.
Technical Indicators
4 hours MACD – The MACD for TRX/USD is now losing momentum in the bullish zone.
4 hours RSI – The RSI for TRX/USD is sliding and it could break the 50 level.
Key Support Levels – $0.0170 and $0.0155.
Key Resistance Levels – $0.0205, $0.0208 and $0.0215.