The market might not have faced a local deep, according to CoinStats.

SHIB/USD
The price of SHIB has dropped by 0.8% over the last day.
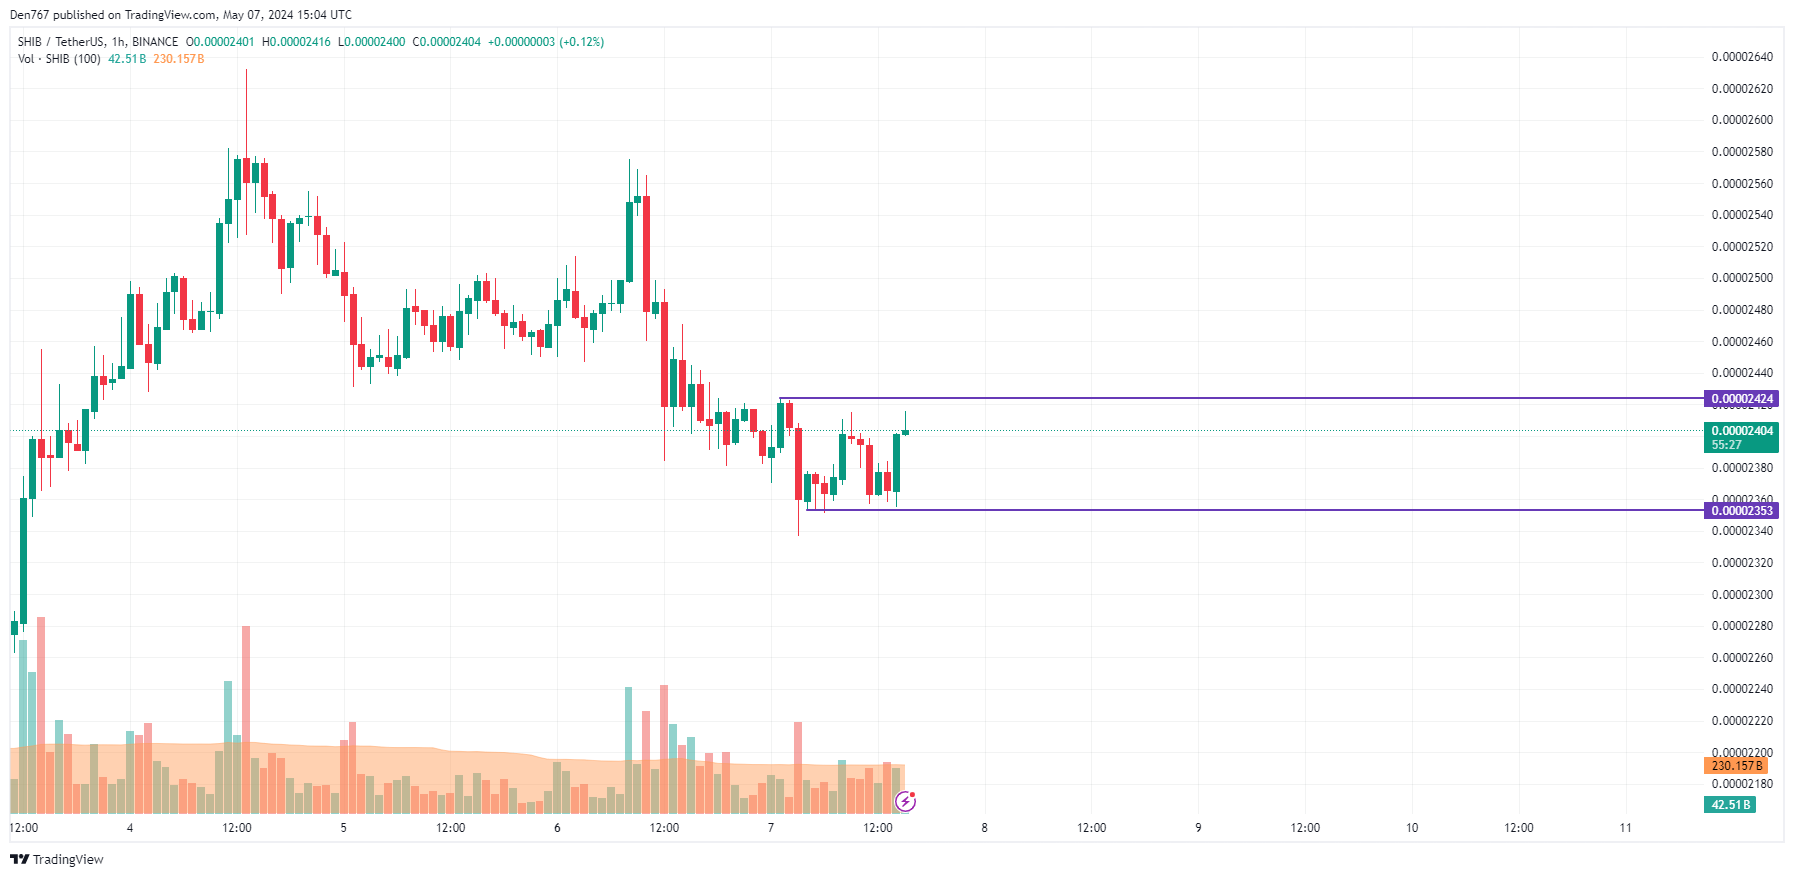
On the hourly chart, the rate of SHIB is approaching the local resistance level of $0.00002424. If the daily candle closes near that mark or above, the accumulated strength might be enough for a breakout, followed by a move to $0.000025.
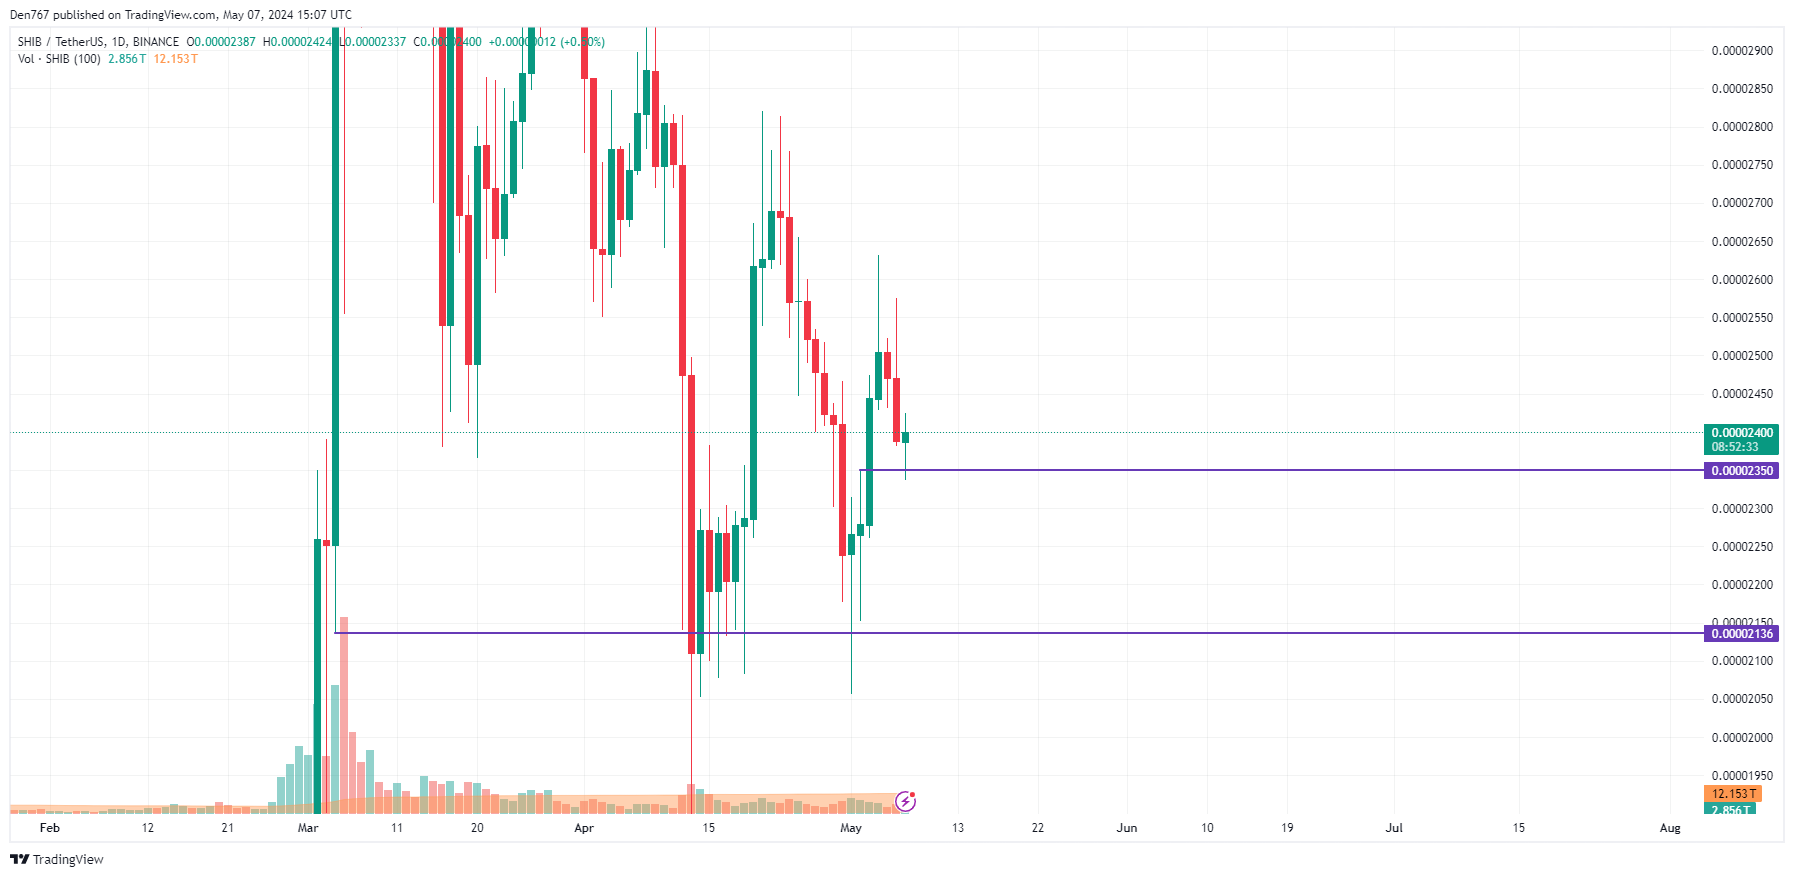
On the bigger time frame, the price of SHIB has bounced off the mirror level of $0.00002350. However, it is too early to think about a reversal as not enough power has been accumulated yet.
In this case, sideways trading around $0.000024 is the most likely scenario.
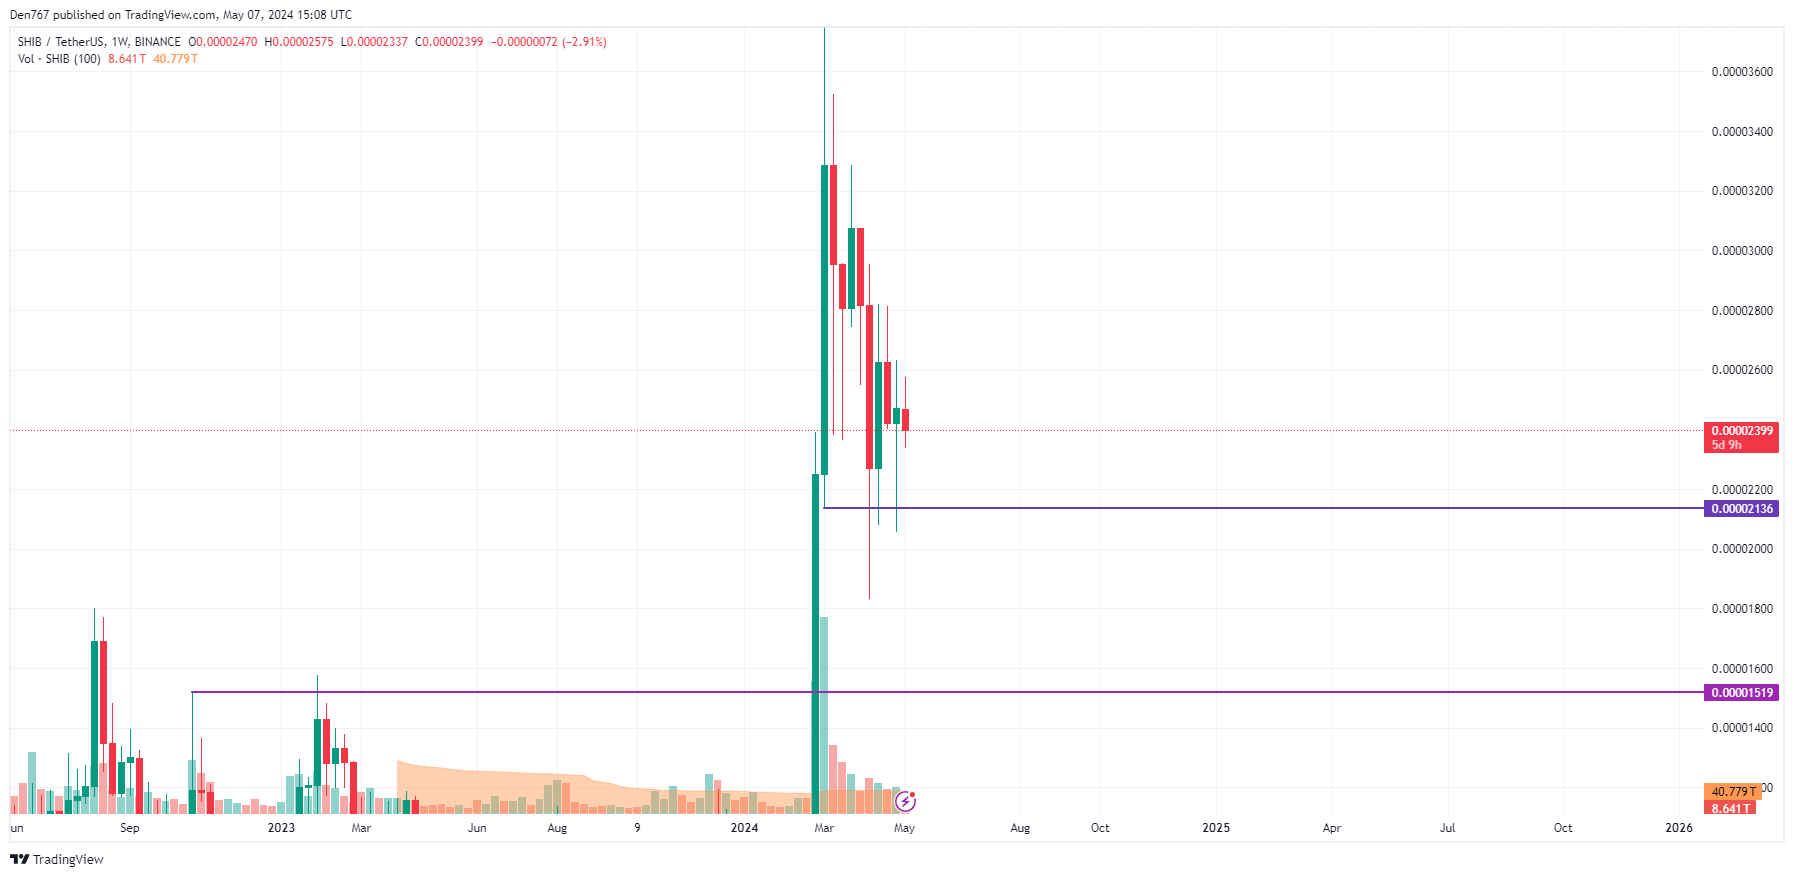
A less positive picture can be seen on the weekly chart. The price of SHIB has tested, several times, the support level of $0.00002136. In case of a drop to this mark, bears may seize the initiative, which can lead to a more profound decline to the vital zone of $0.000020.
SHIB is trading at $0.00002390 at press time.