Today’s market session has seen bears control markets due to movements in the global market cap. The total cap stood at $2.33T as of press time, representing a 1.8% decrease over the last 24 hours. The trading volume also dropped by 20% within the same period to stand at $63.18B.
Ethereum Price Review
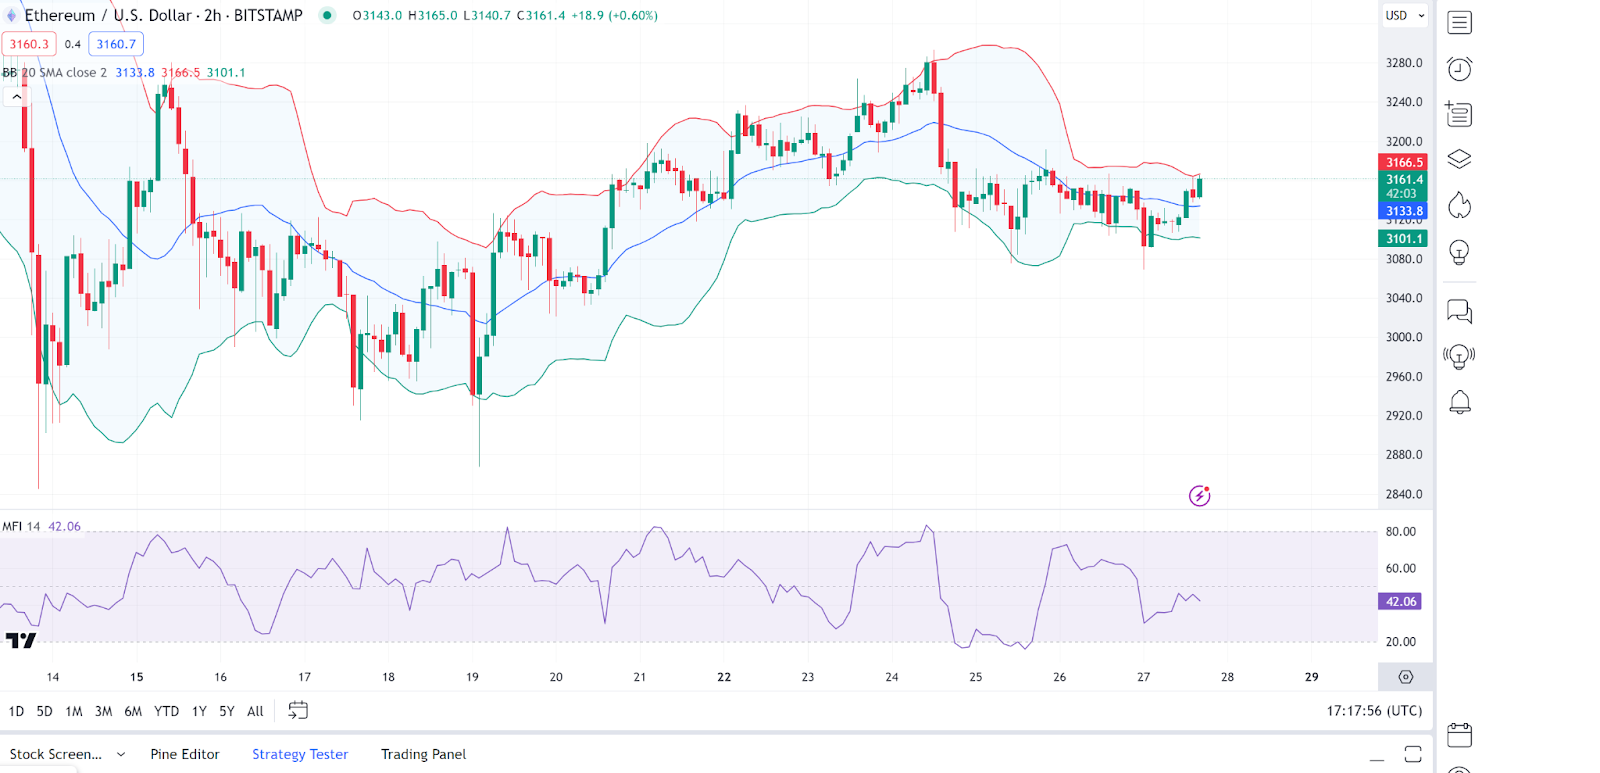
Ethereum ($ETH) has fallen prey to today’s bear sentiment, as evidenced by its price movement. In-depth analysis shows that the Bollinger Bands, which seem to be narrowing, indicate decreased volatility. The Ethereum price fluctuates around the middle SMA band, suggesting a lack of strong bullish or bearish momentum.
On the other hand, the Money Flow Index (MFI) is around 42, which is in the neutral territory, neither indicating overbought nor oversold conditions. As of press time, the Ethereum price stood at $3,173, representing a 1.3% increase from its previous 24-hour price.
Wormhole Price Review
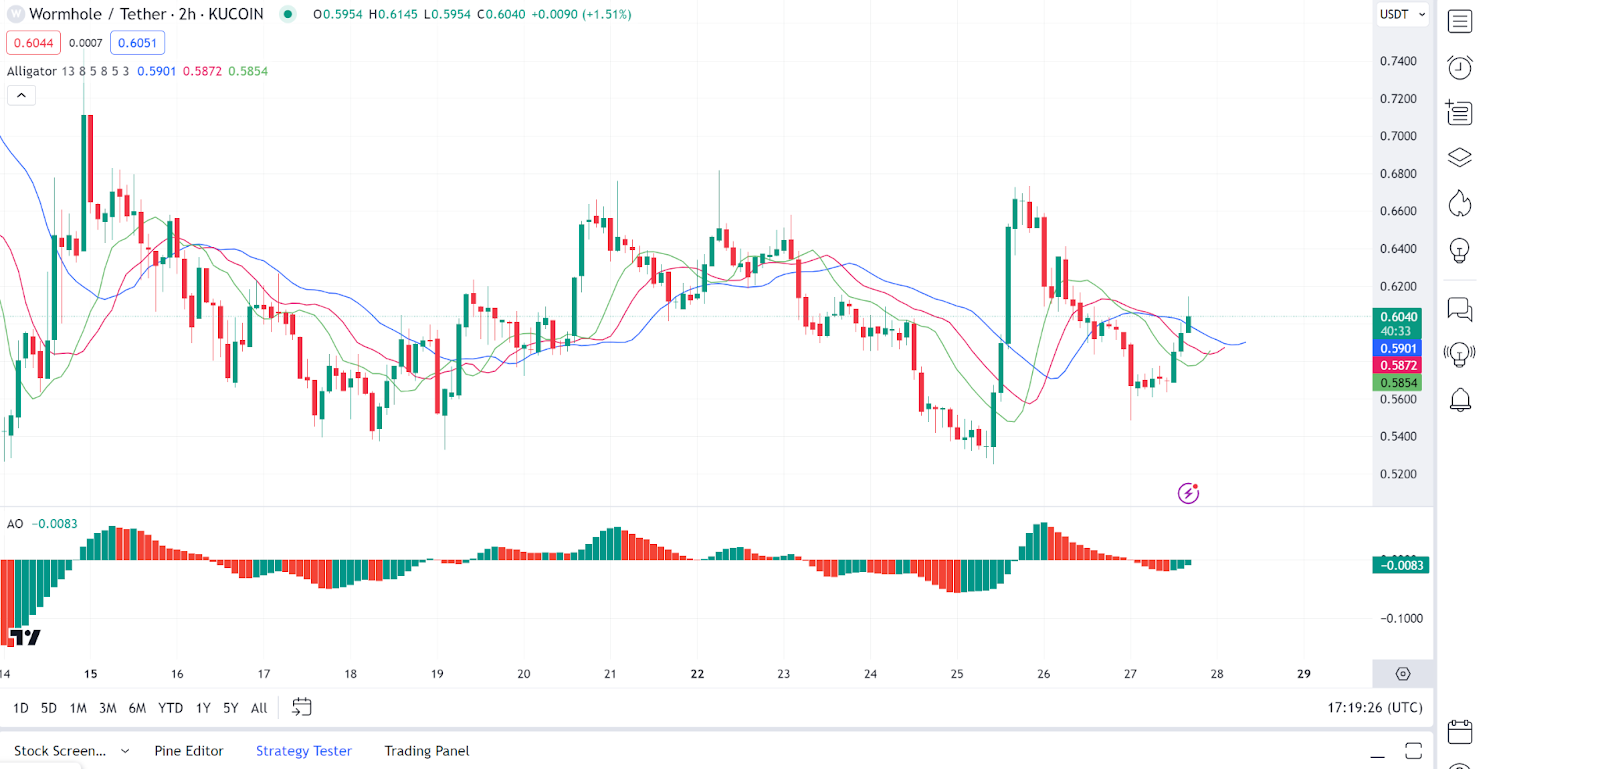
Wormhole (W) is another gainer in today’s session as it emerges among the top gainers. Looking at an in-depth analysis, we see that Wormhole price charts display the Alligator indicator with the jaw, teeth, and lips lines, showing a sideways movement, as the lines are intertwined, suggesting a consolidation phase without a clear trend.
Conversely, the Awesome Oscillator (AO) hovers around the zero line with small bars, further confirming the market’s indecisiveness. As of press time, the Wormhole price stood at $0.6111, representing a 2% increase from its previous 24-hour price.
Optimism Price Review
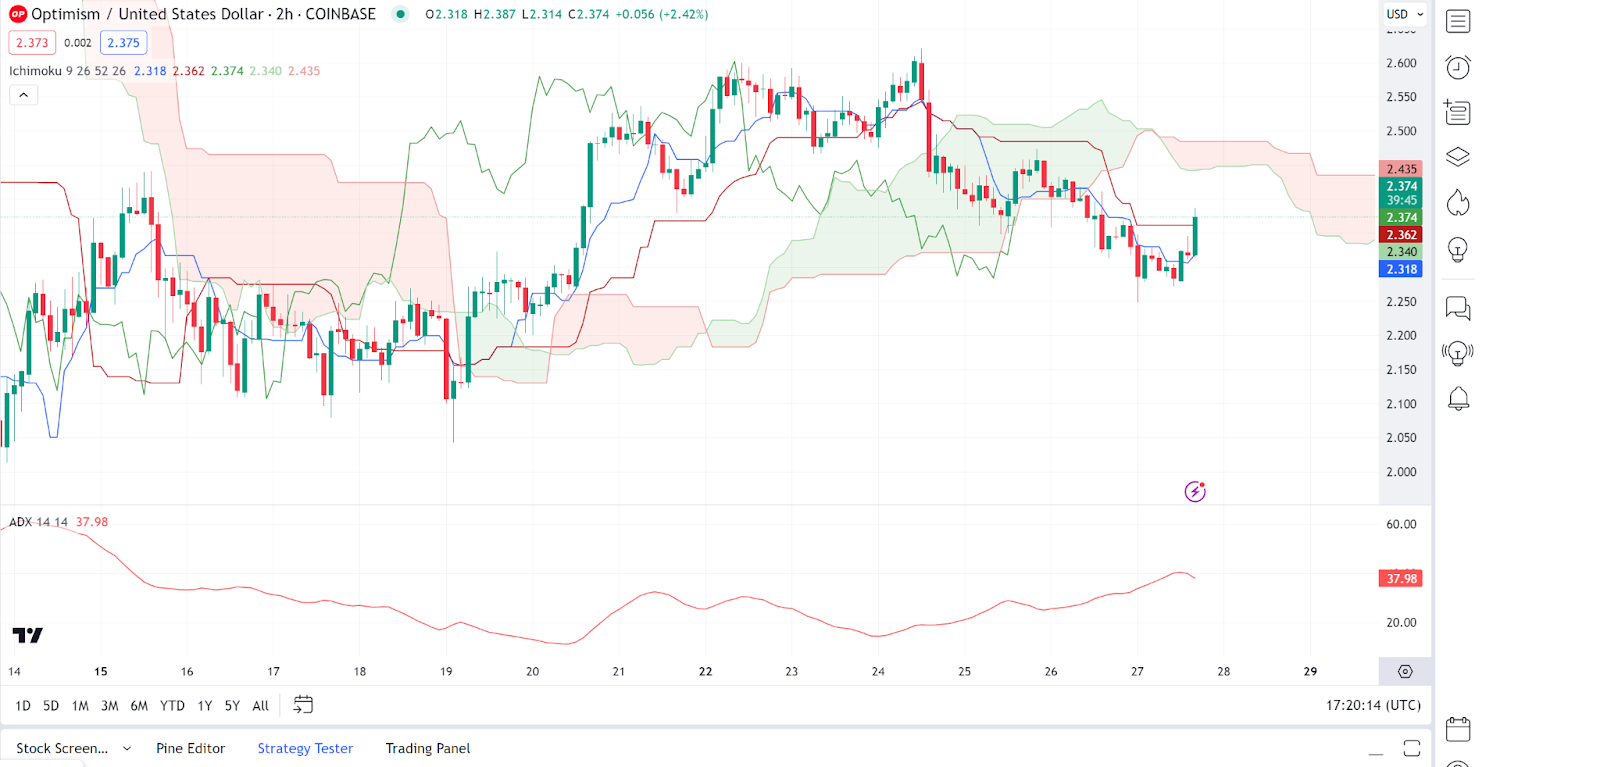
Optimism (OP) is also among the top gainers in today’s session, as its price movements show. Analyzing Optimism price charts, we see that the Ichimoku Cloud is featured here, with the Optimism price currently below the cloud, which may indicate a bearish outlook. However, the cloud ahead is thinning, suggesting the trend may weaken or reverse.
On the other hand, looking at indicators, we see that the Average Directional Index (ADX) is at 37.98, indicating a relatively strong trend. However, given the price position concerning the Ichimoku Cloud, it’s a bearish trend. As of press time, the Optimism price stood at $2.38, representing a 1.92% increase from its previous 24-hour price.
Uniswap Price Review
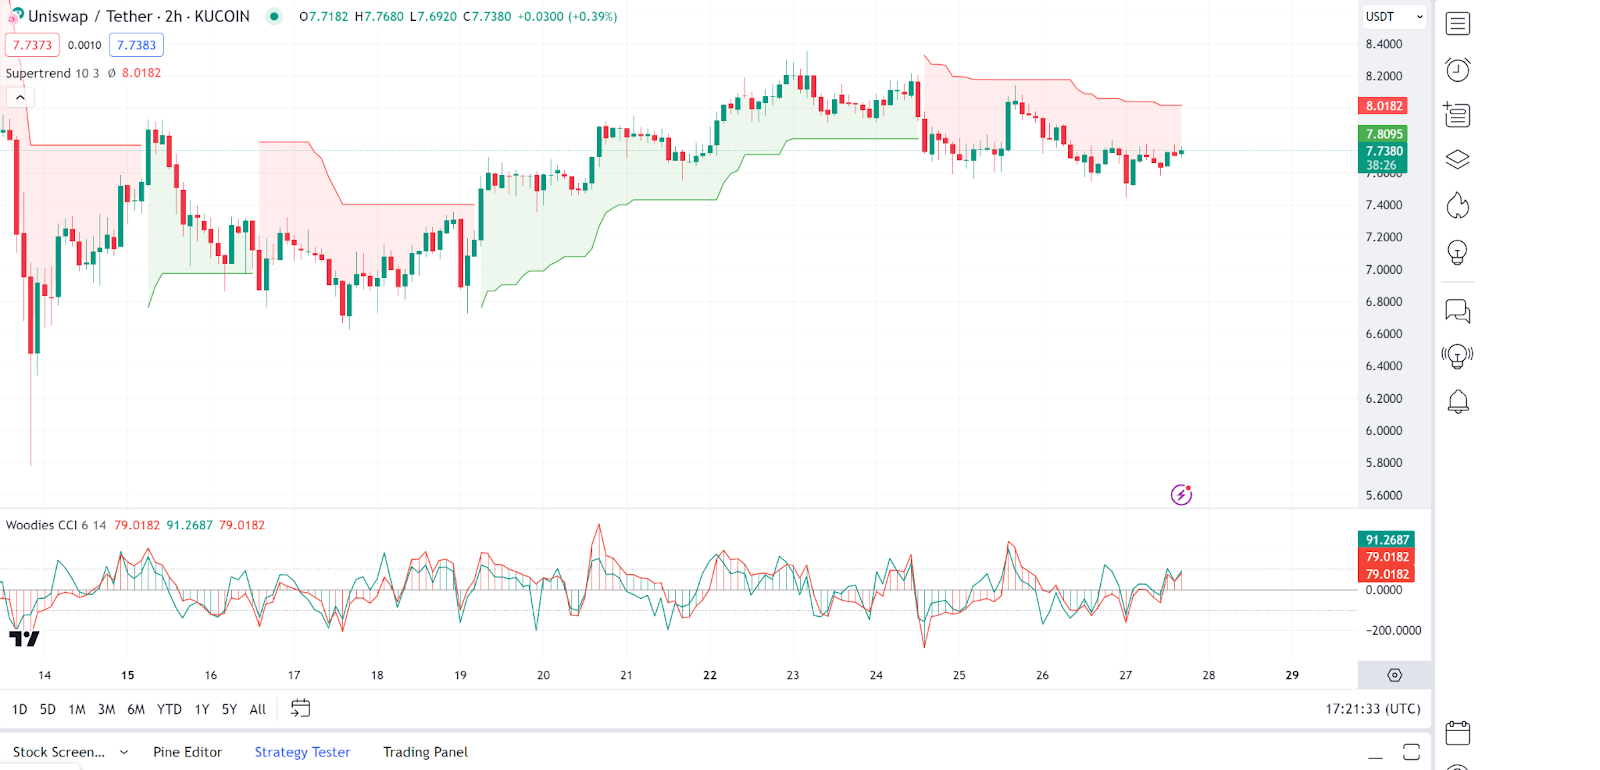
Uniswap ($UNI) also posted some notable gains in today’s session, as evidenced by its price action. Analysing Uniswap price charts, we notice a Supertrend indicator is applied, currently signalling a bearish trend as the price is below the Supertrend line.
On the other hand, the Commodity Channel Index (CCI) shows a recent return from oversold territory, indicating potential buying pressure entering the market. As of press time, the Uniswap price stood at $7.73, representing a 1.31% increase from its previous 24-hour price.
The Graph Price Review
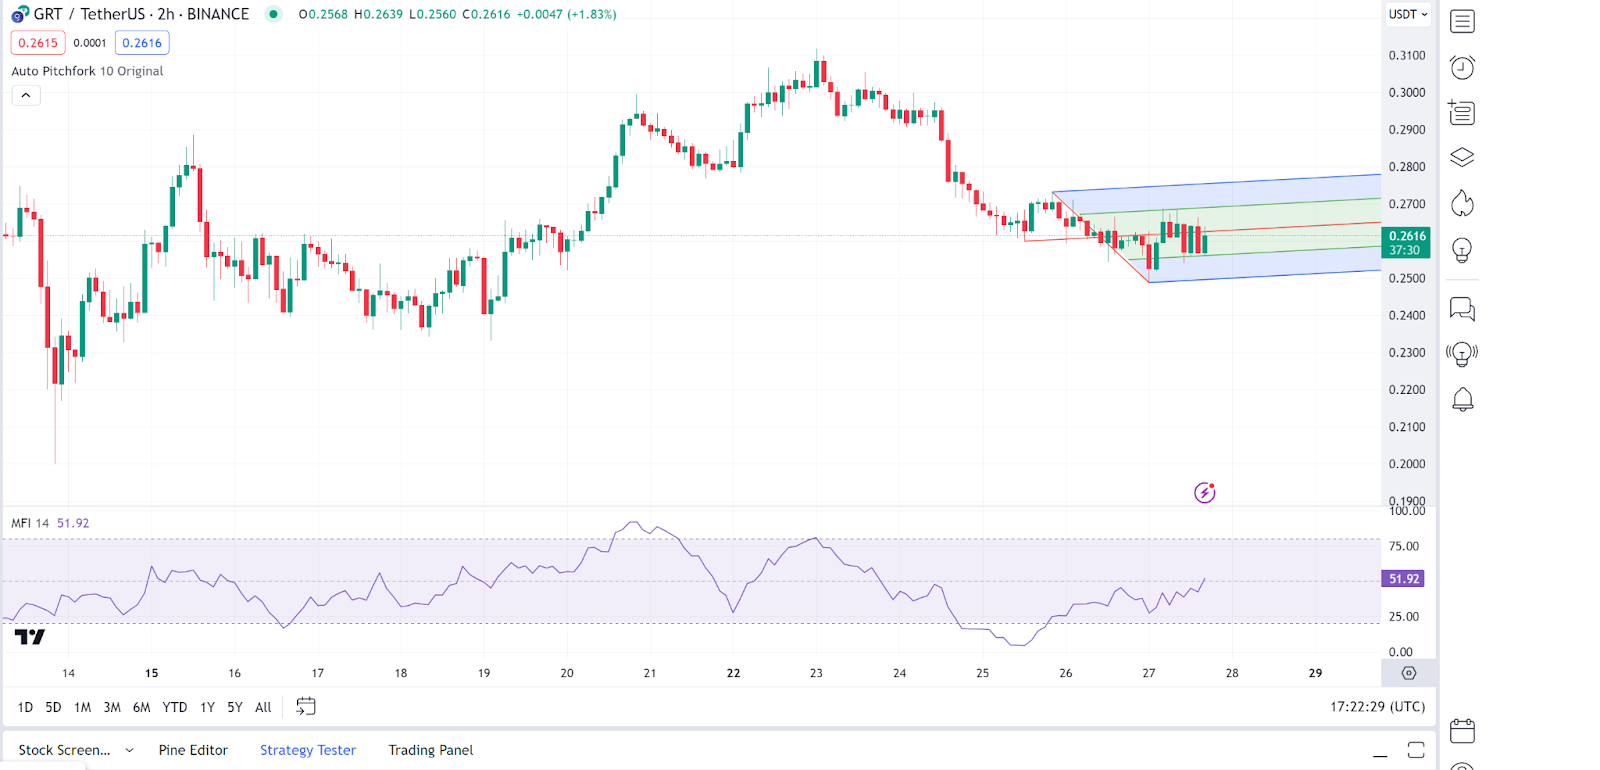
The Graph ($GRT) is another top gainer in today’s session as evidenced by its price movements. Looking at an in-depth analysis of The Graph price charts, we see an Auto Pitchfork tool is used, which shows price consolidation within the pitchfork, suggesting a balanced market between supply and demand.
On the other hand, the Money Flow Index (MFI) is just above the middle at 51.92, which is neutral and does not show any clear overbought or oversold conditions. As of press time, The Graph price stood at $0.2642, representing a 1.76% increase from its previous 24-hour price.