The recent recovery in the crypto market has provided a glimmer of hope for investors, but the question remains: will the prices manage to sustain above key support levels?
Following a correction of approximately 23%, optimism arises for a potential upward movement. However, uncertainties loom over whether this recovery signifies the end of the correction phase or if further downward pressure will persist in the market.
Can Crypto Hold $2.237 Trillion? Watching the 0.382 Fib Support
The crypto market’s ability to hold above the 0.382 Fib support at around $2.237 trillion and potentially close above it this month would signify a bullish turn, suggesting the correction phase is nearing its end.
However, if the market fails to maintain this support level, a correction to the golden ratio support around $1.9 trillion becomes possible.
In the event of a further bearish move, the crucial Fibonacci support at approximately $1.45 trillion would come into play, followed by significant support at the 50-month EMA around $1.236 trillion.
Despite the uncertainties, indicators such as the Moving Average Convergence/Divergence indicator (MACD) histogram’s upward trend and the bullish crossover of the MACD lines offer some optimism, albeit with the Relative Strength Index indicator (RSI) remaining neutral.
Read More: What Is Market Capitalization? Why Is It Important in Crypto?
Three Weeks Strong: Crypto Above $2.237 Trillion Fib Support
The crypto market’s stability above the 0.382 Fib support at approximately $2.237 trillion for three consecutive weeks is notable, yet the lack of a substantial upward momentum raises concerns.
Furthermore, the impending bearish crossover of the MACD lines and the continuous bearish trend in the MACD histogram over recent weeks add to the cautious sentiment.
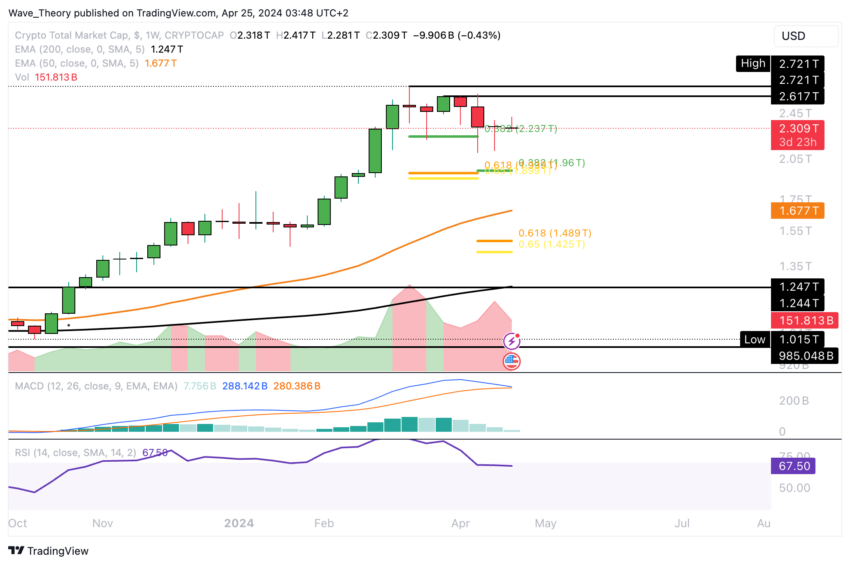
Although the RSI hovers near overbought levels, its inability to provide clear bullish or bearish signals adds to market direction uncertainty.
Crypto Market Sees Recovery After Recent Decline
Recently, the market demonstrated a partial recovery, breaching the resistance of the 50-day EMA at approximately $2.336 trillion. However, this recovery was short-lived, as the market resumed its corrective trend since the day before yesterday.
Despite this, the daily chart still indicates a bullish trend in the short to medium term, as evidenced by the presence of a golden crossover in the EMAs. Additionally, there are signs of potential bullish momentum, with the MACD histogram showing early signs of an upward tick and the possibility of a bullish crossover in the MACD lines.
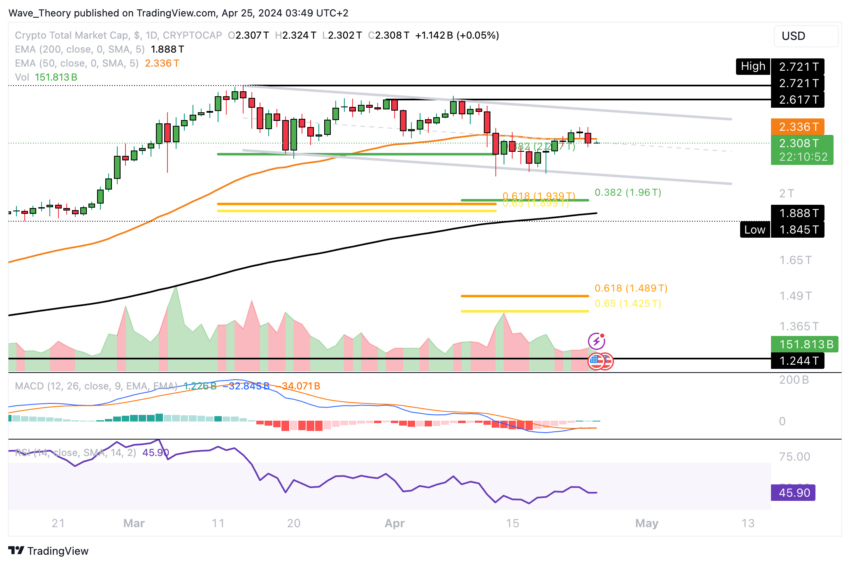
However, the RSI remains neutral, indicating no bullish or bearish sentiment. Should the market sustain its upward momentum, it will likely encounter significant resistance levels ranging from approximately $2.617 trillion to $2.72 trillion.
Death Cross Alert: What the 4H Chart Reveals About Market Trends
The formation of a death cross in the 4-hour chart signals confirmation of the bearish trend in the short term. Additionally, the bearish sentiment is reinforced by the MACD lines’ bearish crossover and the MACD histogram’s downward movement.
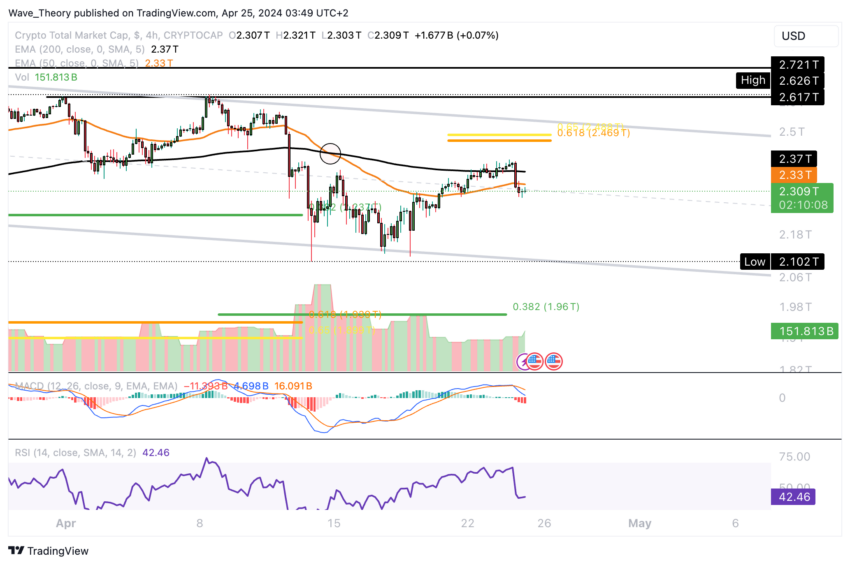
The RSI remains neutral despite these indicators, providing no definitive signals of bullish or bearish momentum. To signal an end to the corrective phase, the market would need to surpass the golden ratio resistance level situated around $2.5 trillion.
Bitcoin Hits Key Fibonacci Support
The BTC price has shown signs of recovery recently but has yet to surpass the crucial golden ratio level of around $68,400. Breaking through this level is necessary to signal an end to the corrective movement.
Read More: How Does Regulation Impact Crypto Marketing? A Complete Guide
However, the price has encountered resistance and initiated a corrective phase in the past couple of days, currently hovering around the 0.382 Fibonacci support at approximately $64,336. If this support level is breached, the next significant Fibonacci support is expected around $62,250.
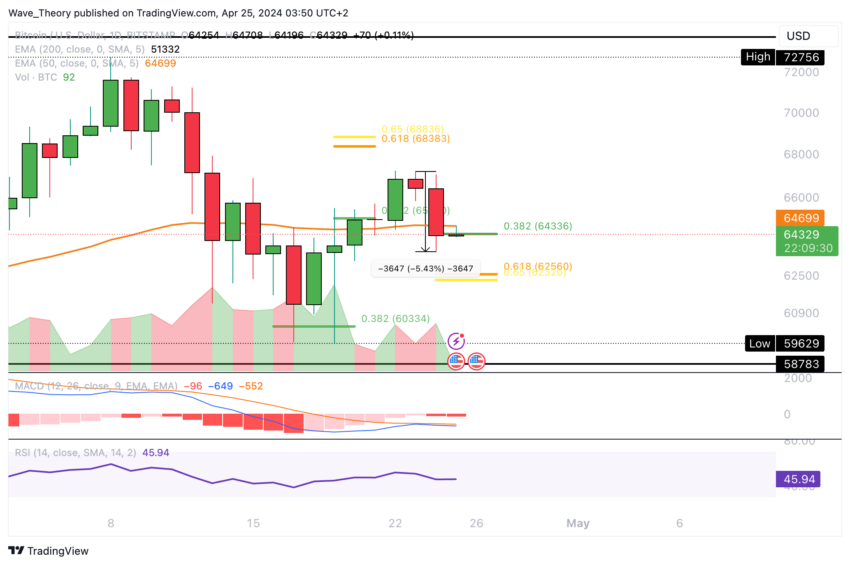
Furthermore, the MACD histogram has been indicating bearish momentum since yesterday, accompanied by bearish crossover of the MACD lines, while the RSI remains neutral, providing no clear direction.