An intriguing pattern has emerged on the price chart of XRP, hinting at a potential monumental surge in value, if historical trends hold true. The focus of attention? The Bollinger Bands, a popular technical indicator in the world of trading.
The current analysis reveals that the indicator, which denotes volatility and price range, is experiencing a remarkable contraction. This phenomenon occurred only once before in 2017, coinciding with an unprecedented surge in XRP's price by a staggering 55,000%. During this period, the price peaked at an astonishing $3,317 per token on Jan. 1, 2018.
For those unfamiliar, Bollinger Bands, devised by renowned trader John Bollinger, consist of a simple moving average and two standard deviations plotted above and below it. The narrowing of these bands typically suggests a period of low volatility, often preceding significant price movements.
Can history repeat itself?
A similar contraction was observed in October 2020, preceding a substantial 700% surge in XRP's value, reaching $1.96 per token by April 2021.
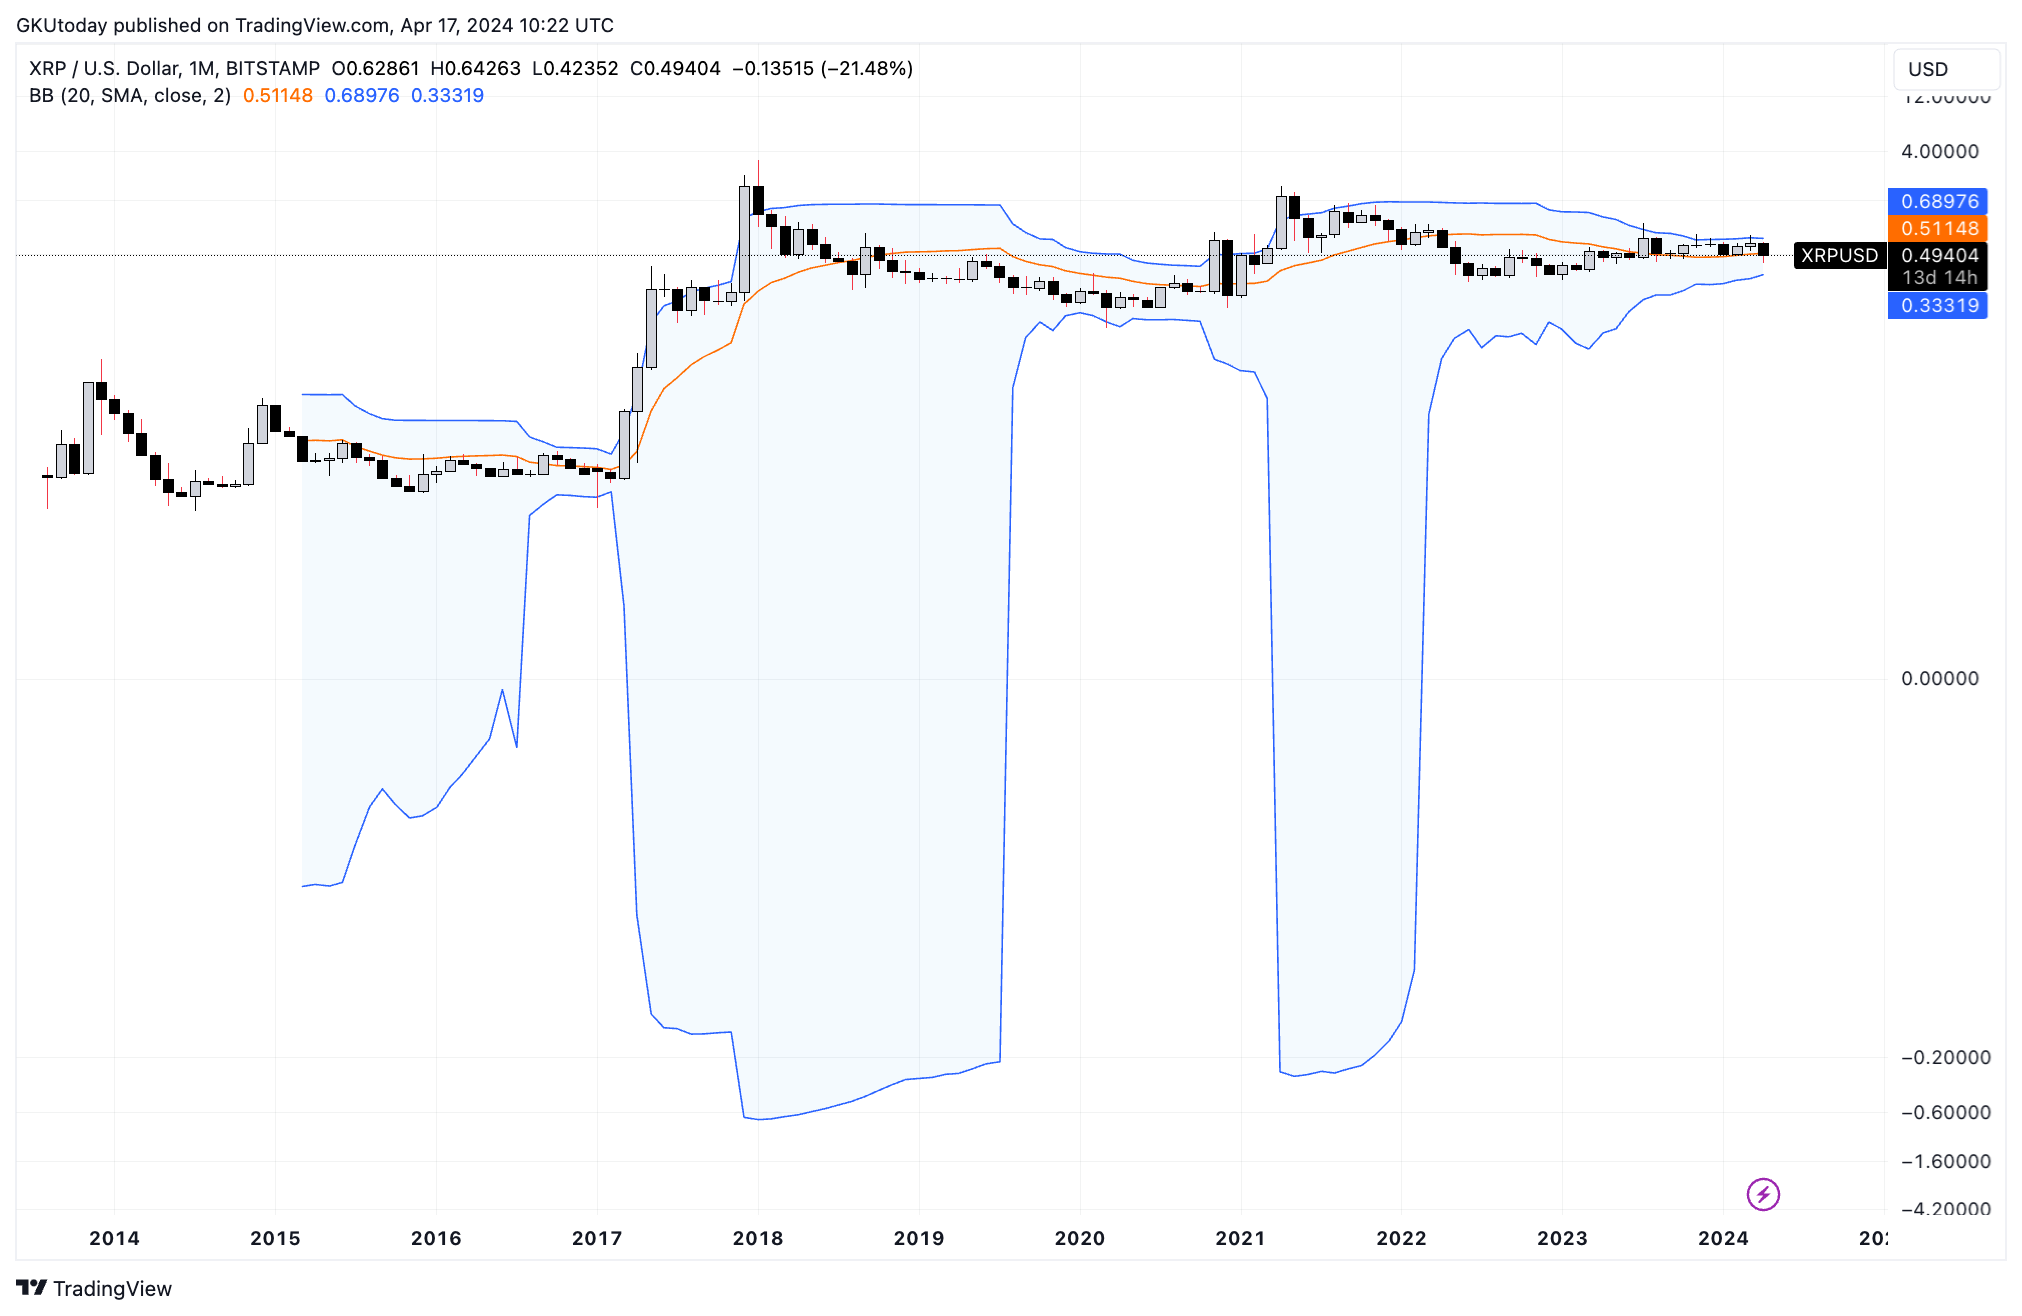
At present, XRP is trading at just below 50 cents per token. The ongoing tightening of the Bollinger Bands, which commenced in November 2022, adds weight to the argument for the potential near-term growth in XRP's value.
While history may not always repeat itself in the chaotic realm of the crypto market, the correlation between XRP's price movements and the Bollinger Bands presents a compelling narrative for investors. However, it is crucial to recognize that nothing is guaranteed there.
Nevertheless, as XRP once again takes center stage in the crypto space, the possibility of a significant price pump looms, fueled by insights provided by Bollinger Bands.